

Bitcoin (BTC/USD)
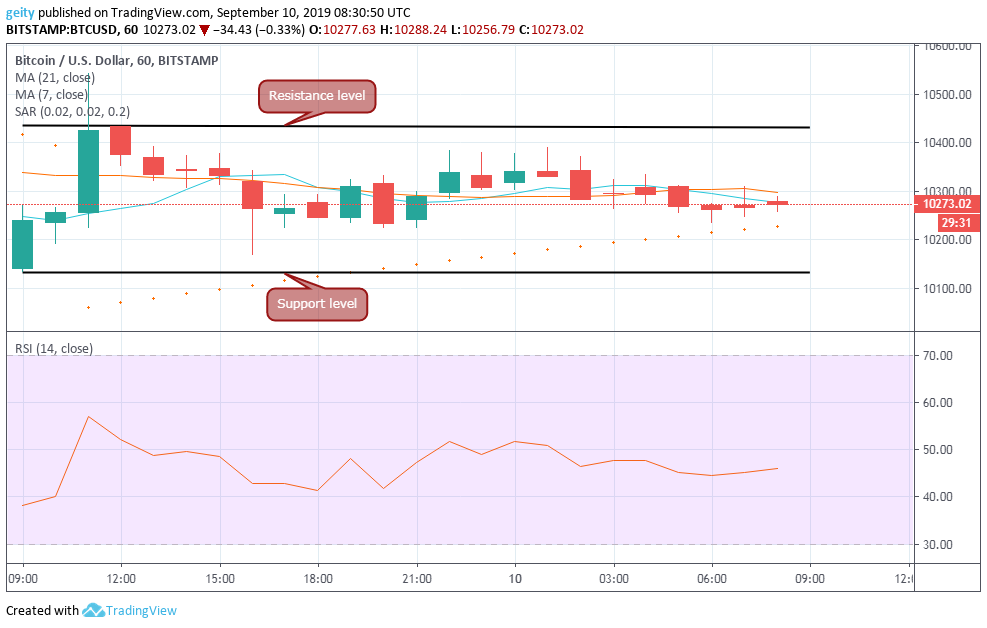
Yesterday’s BTC/USD pair’s upside breakout that rallied the price to a high of $10,542.93 failed to extend the upside rally above the significant resistance level that was defined near $10,426.91.
Moreover, looking at the hourly chart, the pair’s price has been on a sideways movement after experiencing a downward correction that dipped the price to a low of $10,167.62, this led to a steady flow below $10,224.95 level. However, a significant support level was also found near $10,132.21.
BTC/USD pair has dipped by 2% over the last 24hrs, after escalating from the opening price of $10,255.24 to the current rate that is at $10,228.01. Afterward, the market seemed to be indecisive as suggested by the moving averages that are intertwining, and the RSI that is seen between level 40 and 60 also signifies a lack of dominance.
Forecast
An upward price rally should be anticipated since the parabolic SAR is at the press time hovering below the candles that give investors a buy signal. However, investors should expect an upside correction above the resistance level $10426.91 to take a long position. Conversely, a break below support level $10132.21 may lead to a decline near $9000.00.

Ethereum (ETH/USD)
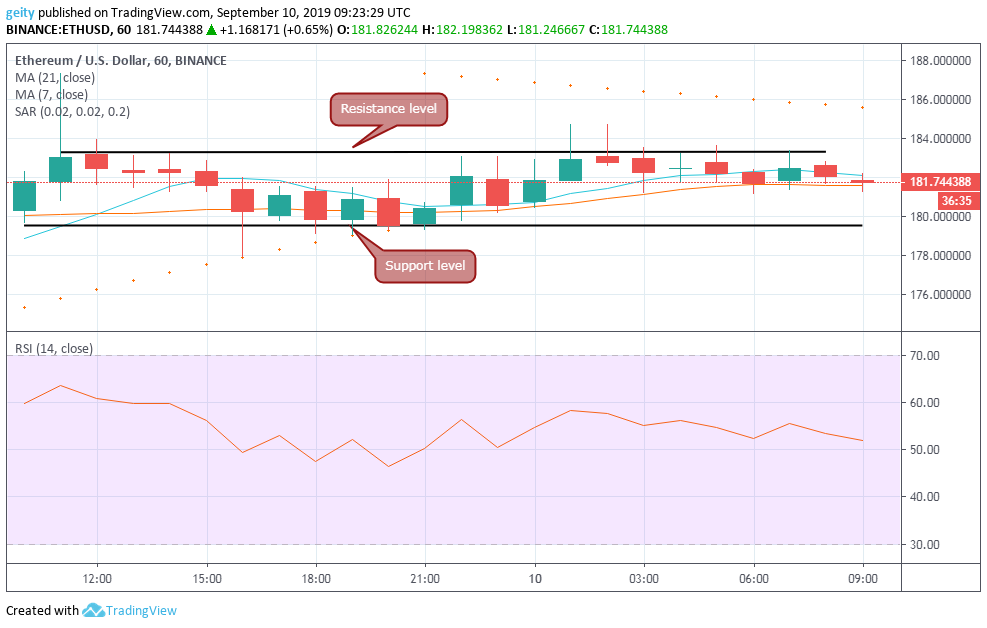
ETH/USD pair is on a slow movement, consolidating between $183.22 and $179.79 resistance and support level. The pair’s price began the session trading at $181.32 and is now exchanging at $181.74, that shows a slight recovery. In terms of technical indicators, the short-term SMA has been gravitating above the long-term SMA that signaled a bullish outlook.
The RSI indicator, on the other hand, shows equality and indecisive market condition. This is since it’s now ranging between level 40 and 60. However, the fact that the RSI indicator is still above average gives investors hope for better price digits in the near term.
Forecast
ETH/USD pair is likely to continue higher above the $190.00 level if the bulls manage to breach the significant resistance level that was found near $183.228. However, the parabolic SAR suggests otherwise, since it is seen above the candle, which gives a sell signal to investors. A downside break below $179.800 may trigger a further southward move towards $175.00.
Ripple (XRP/USD)
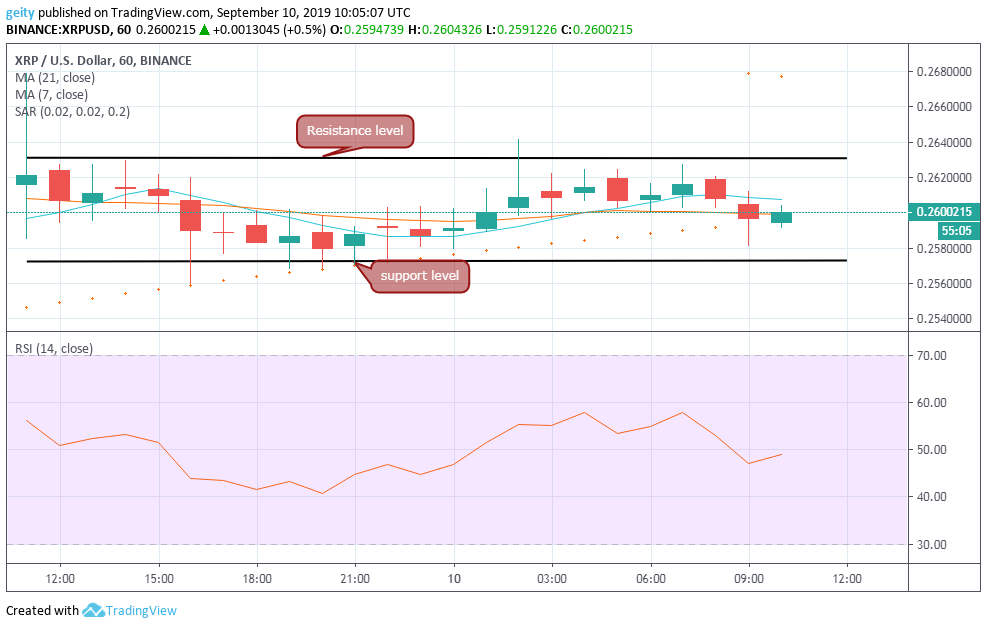
XRP/USD pair is also trading sideways with shallow volatility levels. However, it has held strong support and resistance level near $0.257 and $0.263 over the intraday.
Additionally, the sideways momentum has been reflected by the intertwining moving averages. Besides, the RSI indicator is pointing north, and the short-term SMA is above the long term SMA that suggests a positive sign.
Forecast
There is a high chance for an upside correction, as suggested by most technical indicators. If the bulls push the price above $0.260, it may mark the end of downside pressure.
But, if sellers succeed to drag the price below $0.257, then a downside move near $0.240 could be seen. Notably, the parabolic SAR is now trading above the candles, which gives a sell signal.
Disclaimer: The views and opinions expressed here are solely those of the author and do not necessarily reflect the views of ZyCrypto. None of the information you read on ZyCrypto.com should be regarded as investment advice. Every investment and trading move involves risk, you should always conduct your own research before making any investment decision.


