Bitcoin BTC Technical Analysis – Speculators Continue to Debate if BTC is Showing Bullish Trend Signs; Meanwhile the 100 DMA crosses below the 200 DMA.
Bitcoin has seen a 3% price drop over the past 24 hours of trading. The cryptocurrency is currently exchanging hands at a price of $6427 after seeing a small 1.19% price increase over the past 7 trading days.
Speculators continue to debate as to whether the bear trend is showing signs of fading over the past few weeks. With people looking at indicators such as price action crossing above the 200 day moving average as a sign that the bear market is finishing. However, price action has crossed the 200 day moving average in April, July and September of 2018 and each cross has failed to produce a bullish run.
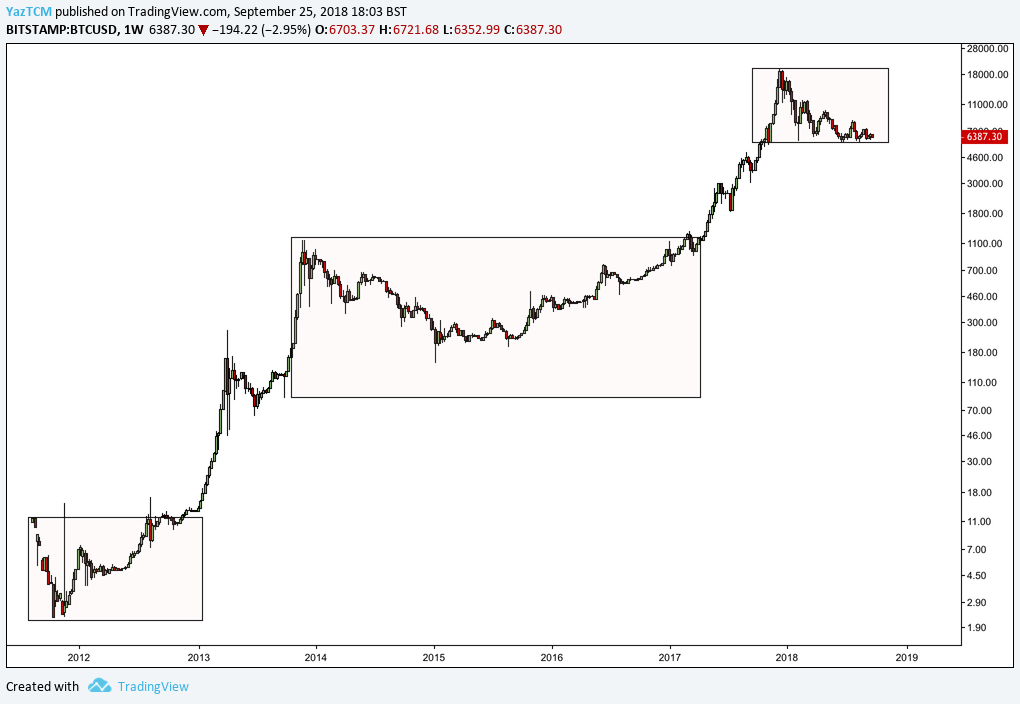
It is important to highlight that the Bitcoin market has only been in a bull/consolidating period around three times since 2011, all of which are highlighted on the log chart below;

https://www.tradingview.com/x/ay3rISMv/
It is apparent that there are only these three highlighted extended periods in Bitcoin’s entire history when the market was not trading in a bullish manner. We just so happen to currently be trading within the consolidation period right now.
Bitcoin continues to dominate the cryptocurrency markets with the number 1 ranking position in terms of overall market cap across the entire industry. It has a total market cap value of $111 billion as the 65 month old coins trades at a price that is 67% lower than its all time high value.
Let us continue to analyse price action for Bitcoin over the short term and highlight any potential support and resistance areas.
Price Analysis
BTC/USD – SHORT TERM – DAILY CHART
https://www.tradingview.com/x/1bCVXIRs/

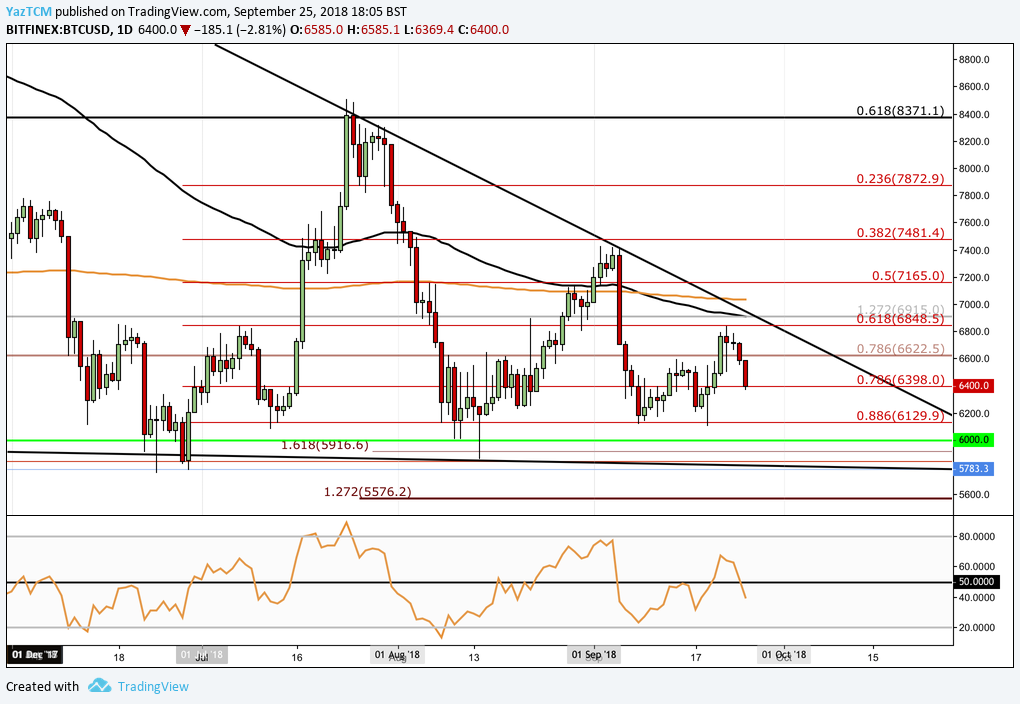
Analysing price action from the short term perspective above, we can see that the market had experienced a bullish run during July when price action started at a low of $5780 on the 29th of June 2018 and extended to a high of $8506 on the 24th of July 2018. This was a price increase totalling 50% from low to high.
We can see that after placing the high, and meeting resistance at the upper boundary of the long term triangle, price action rolled over. It continued to decline during August until meeting support at the short term .886 Fibonacci Retracement level priced at $6129. This Fibonacci Retracement is measured from the entire bullish run outlined above.
We can see that the $6129 level provided significant support as the market rebounded from this area. It continue to rally again towards the end August 2018 until meeting resistance, once again, at the upper boundary of the triangle formation.
We can see that price action tumbled as September started to trade until the market found support at the .886 Fibonacci Retracement level priced at $6129 again.
The market is now trading at support provided by the .786 Fibonacci Retracement level priced at $6398.
If the bearish momentum continues within the market and pushed price action below the $6398 support, we expect further immediate support below to be located at the $6129 handle. If price action continues further lower than this than more support can be found at the $6000 handle followed by the lower boundary of the triangle.
ALternatively, if the bulls can regather momentum from this support level then we expect immediate resistance higher to be located at the long term .786 Fibonacci Retracement level priced at $6622. Further resistance above this can then be expected at the short term .618 Fibonacci Retracement level priced at $6845 followed by the upper boundary of the triangle.
The technical indicators within the market have recently swung into the favour of the bears as the RSI penetrate below the 50 handle. If the RSI remains under the 50 handle we could see the market continue to head further lower.
One significant thing to note is, as everyone worries about price action crossing above the 200 moving average, people are failing to notice that the 100 day moving average has crossed UNDERNEATH the 200 day moving average toward the start of September 2018. This has not occurred since 2015 and could signal that the. Bearish momentum has still yet a long way to go.


