
 Analysis #005 - BTC Breaks Back Into Descending Triangle Formation")
Bitcoin has experienced sideways this movement following last weeks crypto market carnage where markets purged over $70 billion in market value over 7 days. Bitcoin is currently up 2% over the past 7 days and is exchanging hands, at the time of writing, at a price of $6,700.
The cryptocurrency markets have experienced a turbulent month over the past 30 days, as evidenced by the graph below. Total market cap for all cryptocurrencies fell from a high of $381 billion on the 21st of May to a low of $265 billion on the 13th of June. The total market cap has since recovered slightly and is currently trading at $285 billion.
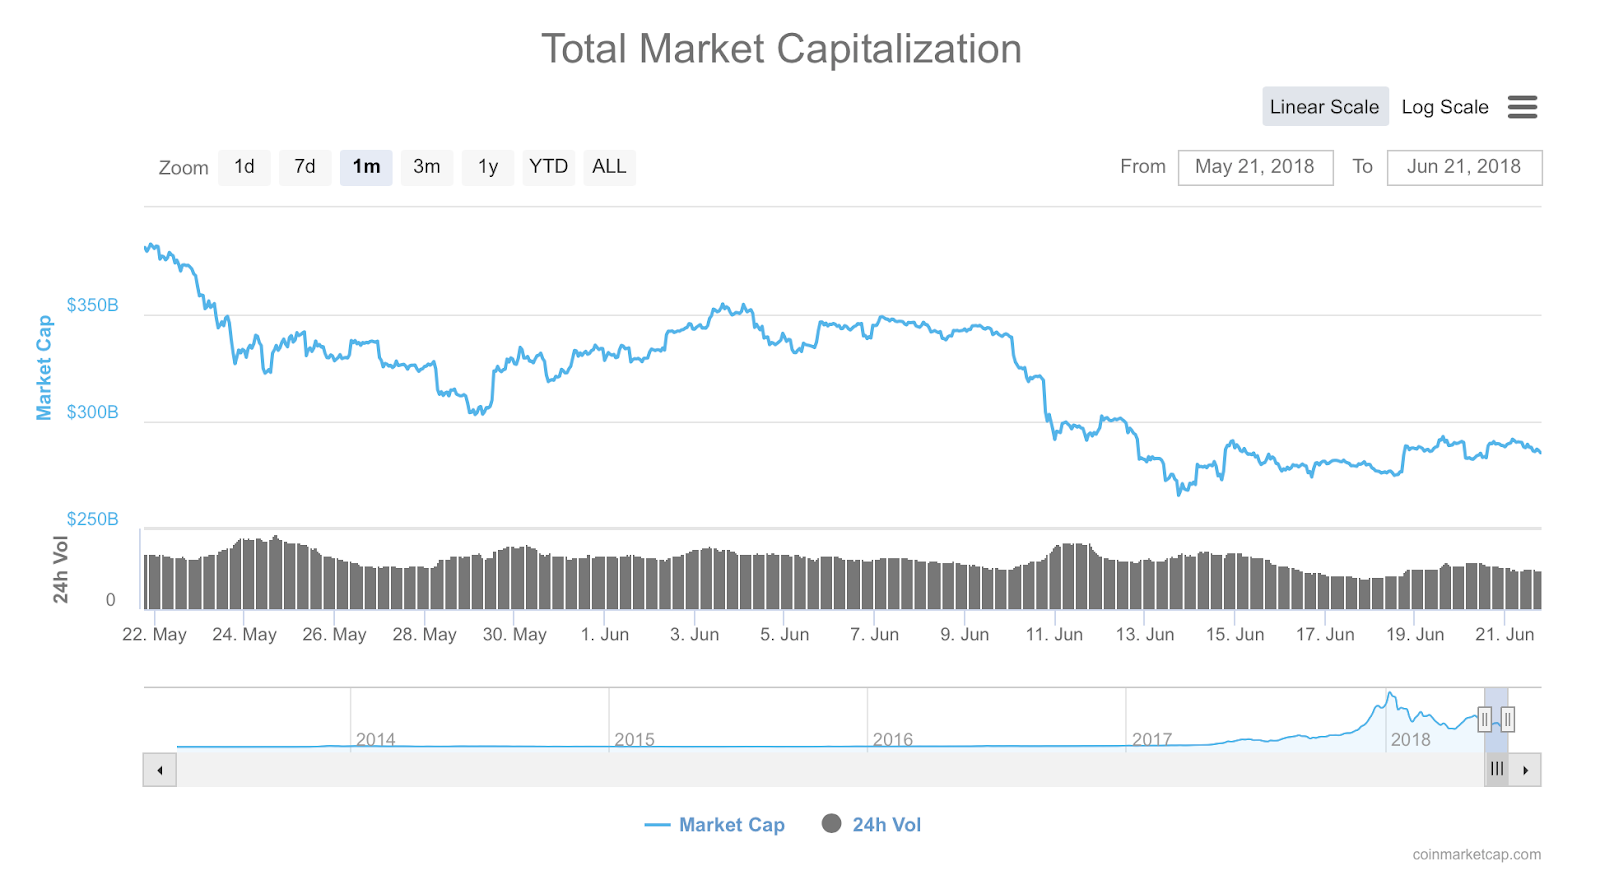
This drop in market cap comes off of the back of fears of price manipulation within the market mixed with low trading volume relative to the start of the year, causing the market cap to slide.
Let us analyse price action over the recent term.
Price Analysis
BTC/USD – LONG TERM – DAILY CHART
https://www.tradingview.com/x/IS0BZMZ7/
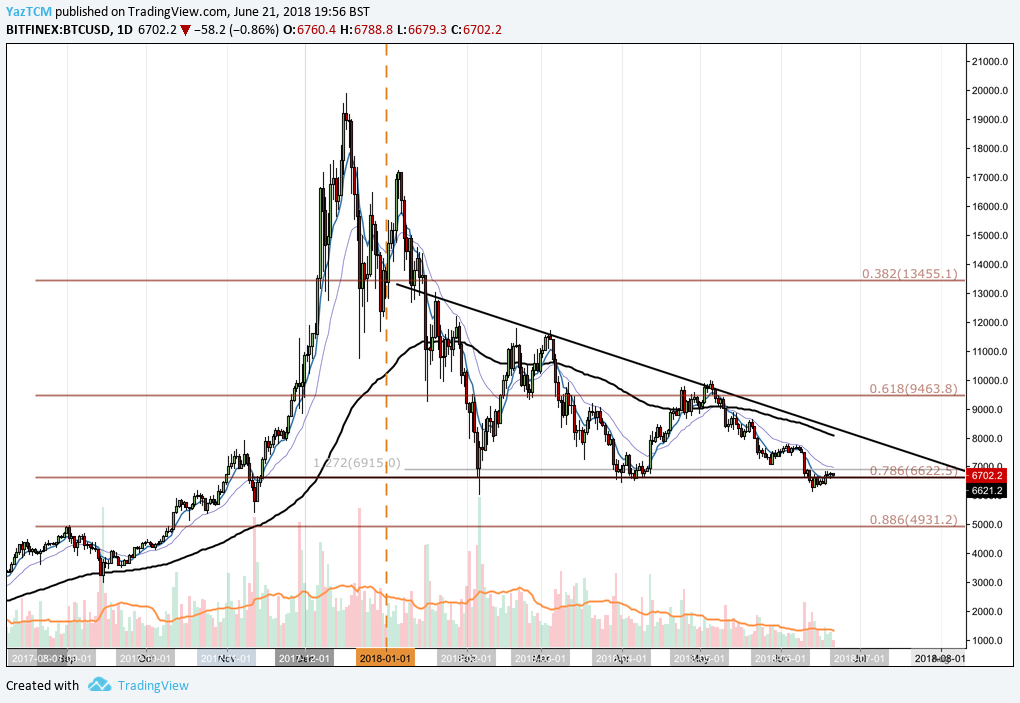
We can see that Bitcoin had experienced an incredible bullish run starting from October last year and placing a high mid December at $19,891. Since then price action has fallen drastically and we are currently trading around 66% lower than the all time high.
Throughout the majority of the year price action has traded within the confines of the descending triangle annotated above. The market recently dipped below the lower boundary of the triangle but managed to recently recover back above this boundary in the recent trading period.
We can also see that price action has fallen all the way to the long term .786 Fibonacci Retracement located at $6,622. This is a retracement taken from the bullish run seen toward the end of 2017.
If the bears manage to direct price action back below the descending triangle then the closes level of support may be located at $6,000 followed by $4,931 which is the .886 Fibonacci Retracement.
Alternatively, if the bulls can manage to increase momentum they may be able to push price action back above the upper boundary of the descending triangle, estimated around the $8,000 handle. If the bulls can then push the market further, price action could go on to retest the .618 Fibonacci Retracement at a price of $9,463 before going to to battle the $10,000 handle once again.
The continued falling volume is causing concern for some investors as average daily volume continues to fall week on week. For any significant bull run to occur we will need to see a significant pick up in the volume traded.
Let us analyse price action over the recent term a little more closely.
BTC/USD – SHORT TERM – DAILY CHARTS
https://www.tradingview.com/x/2WB3Bzw8/
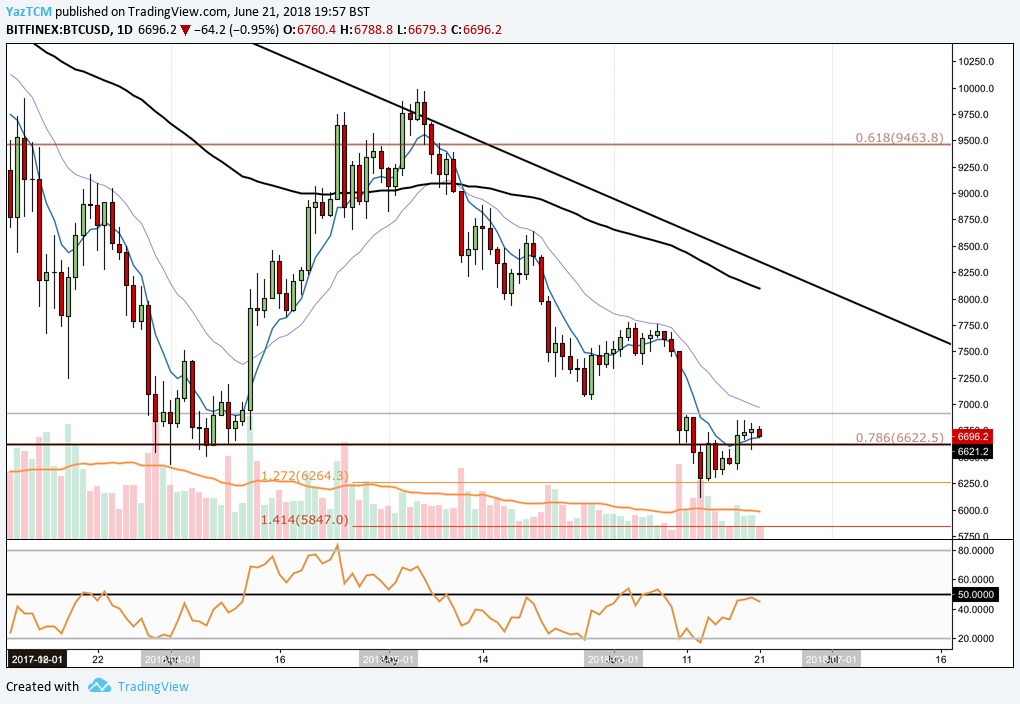
Looking at price action over the past 3 months, we can see that Bitcoin had experienced a bullish run during the month of April. However, the market began to roll over and head back down during the month of May and recently price action has dipped to fresh 2 month lows as price action temporarily dips below $6,250.
We can see that the market found support on the 1.272 Fibonacci Extension at a price of $6,264, before rebounding and reentering the descending triangle. This is a Fibonacci Extension from the entire bearish leg seen during May.
If the bulls can find further support at the lower boundary of the descending triangle, they may be able to use this as a platform to push the market further up. The closes level of resistance on the near term first comes in at the psychological round number $7,000. Following this, the bulls will need to battle against the monthly highs located at $7,779.
Alternatively, if the market fails and breaks back below the descending triangle, then near term support comes in firstly, at the 1.272 Fibonacci Extension with a price of $6,262, closely followed by the 1.414 Fibonacci Extension with a price of $5,847.
The technical indicators are starting to show some favour toward the bulls. Although the RSI is trading below the 50 handle, it has recently made an attempt to break above it. If the RSI can break and hold above 50 on it’s next retry then this will indicate to the bulls that the bearish momentum within the market is fading.
To further add to this favour, the 7 day EMA has recently changed its trajectory and is now pointing in a bullish manner. If the 7 day EMA can go on to cross the 21 day EMA this would send signals to the bulls within the market that the bullish pressure is seriously beginning to build.


