

On May 25th, Checkmate, Lead On-chain Analyst at Glassnode, stated that Bitcoin is at a crucial point that could lead to a significant correction, as several indicators suggest.
Checkmate explained to his Twitter followers that to assess the potential correction, it is important to analyze the behaviour of Short-Term Holders, as they are mostly responsible for significant price movements in BTC.
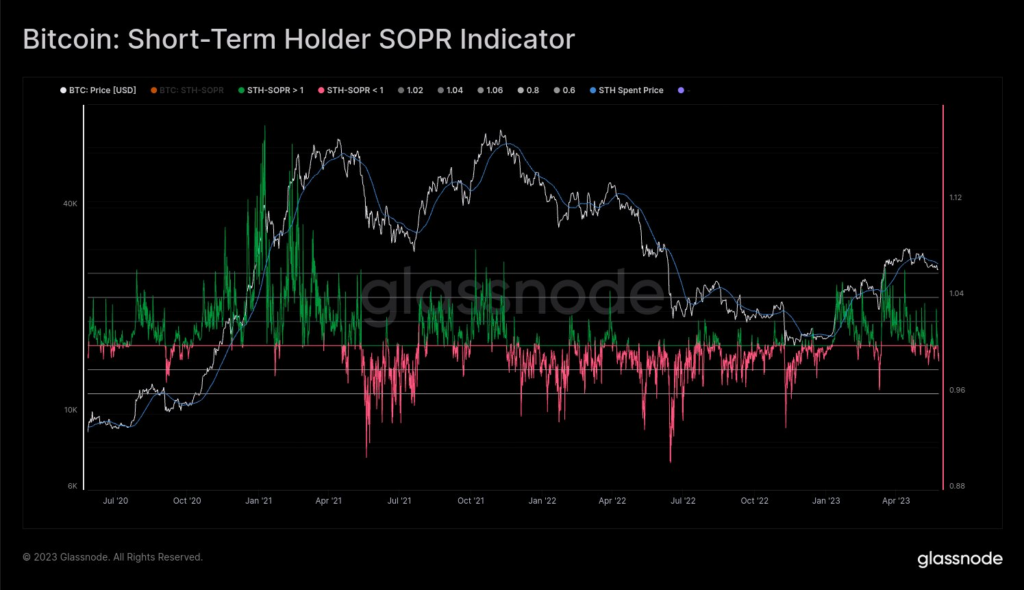
Several metrics indicate a potential correction in Bitcoin’s price
The Glassnode analyst pointed out that one of the most important metrics to consider is the Short-Term Holder Realized Price, which is currently being tested around the $26,500 zone. This level should provide strong psychological support, as losing it could result in a higher drop.
Similarly, Checkmate explained that the STH-SOPR, which indicates the Dominance of Losses of Short-Term Holders, is below 1.0. This means that the losses of Short-Term Holders are mainly generated by local top buyers, which is uncommon and generally creates a bullish reaction driven by the fear of missing out on an upward movement (FOMO).
Regarding the Short-Term Holder Profit/Loss Ratio, the metric has reached a state of balance, indicating a possible healthy short-term market cleansing. However, the analyst warned that losing the current values could generate negative sentiment in the short term.

Bitcoin’s price could be on the brink of a significant correction
Lastly, Checkmate highlighted that the STH Profit/Loss momentum tool, designed to detect rapid changes in market trends, is currently at a neutral level. Nevertheless, if it starts to show deterioration, it could be a clear signal of a deeper correction, as has happened on other occasions.
“We must observe these marginal buyers and sellers. On-chain analysis of Short-Term Holders provides precisely this, a view into the most economically active participants right now.”
It’s important to note that most of the charts the analyst presents use daily timeframes, so it is normal to expect substantial movements of up to $10,000.
Although the indicators provide valuable information to understand the current Bitcoin and cryptocurrency landscape, they are not entirely infallible when it comes to trading crypto. Therefore, closely observing key levels and market reactions and conducting thorough research before investing in these assets is essential.


