
 And Stellar (XLM) Price Analysis and Forecast")
Supply zones: $0.42, $0.46, $0.49
Demand zones: $0.39, $0.35, $0.32
XRP/USD Long-term Trend: Bearish
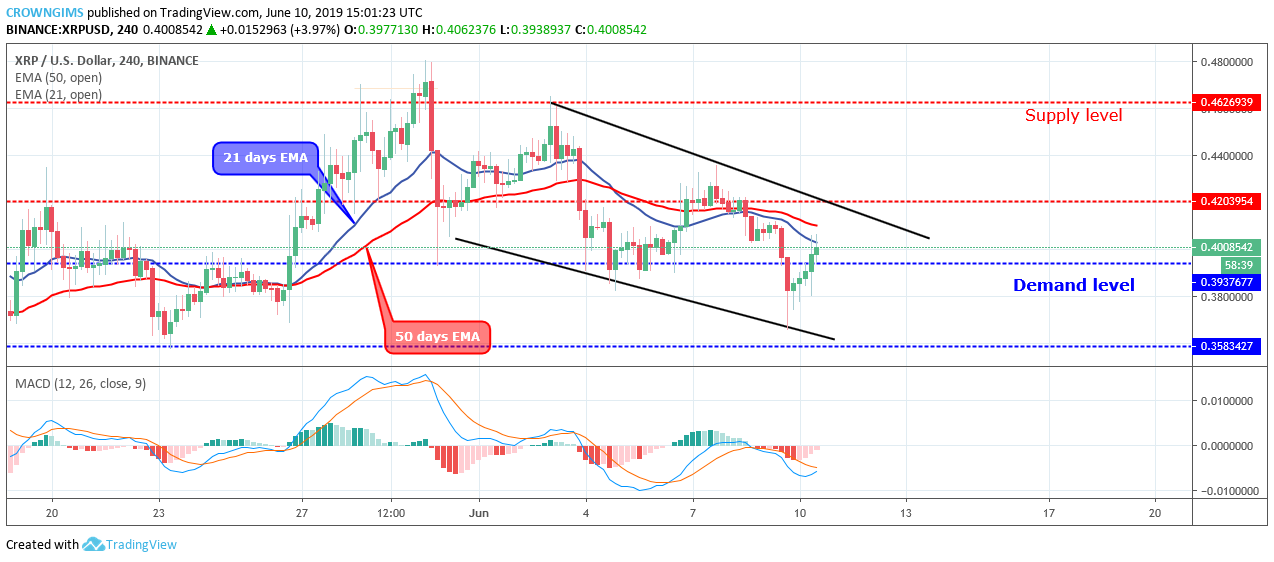
On the 24-Hour chart, XRP/USD was bearish. The Bears were in control of the XRP market. The price action has formed a descending channel on the 4-Hour chart. The coin found support at the demand level of $0.39 on June 05, the Bulls gained a pressure and the price was pushed up to break up the $0.42 supply level.
The breakout looked like a bogus one as the Bears quickly opposed the increase in price; the bullish candle turned to inverted harmer, which is a bearish reversal candle pattern. The XRP price dropped below $0.39 level and the bearish momentum extended towards the demand level of $0.35 on June 09. Today, the Bulls have taken over the XRP market with the formation of more bullish candles with the price moving towards the $0.42 price level.

Should the Bulls maintain or increase their momentum, the $0.42 price level may be reached and the upper trend line of the channel to target $0.46 level. In case the supply level of $0.42 holds the price, it will reverse like before within the channel.
The coin is about breaking up the 21 periods EMA and 50 periods EMA. The Moving Average Convergence Divergence period 12 with its histogram is faintly crossing above zero levels and the signal lines pointing up to indicate a buy signal.
XRP/USD medium-term Trend: Bullish
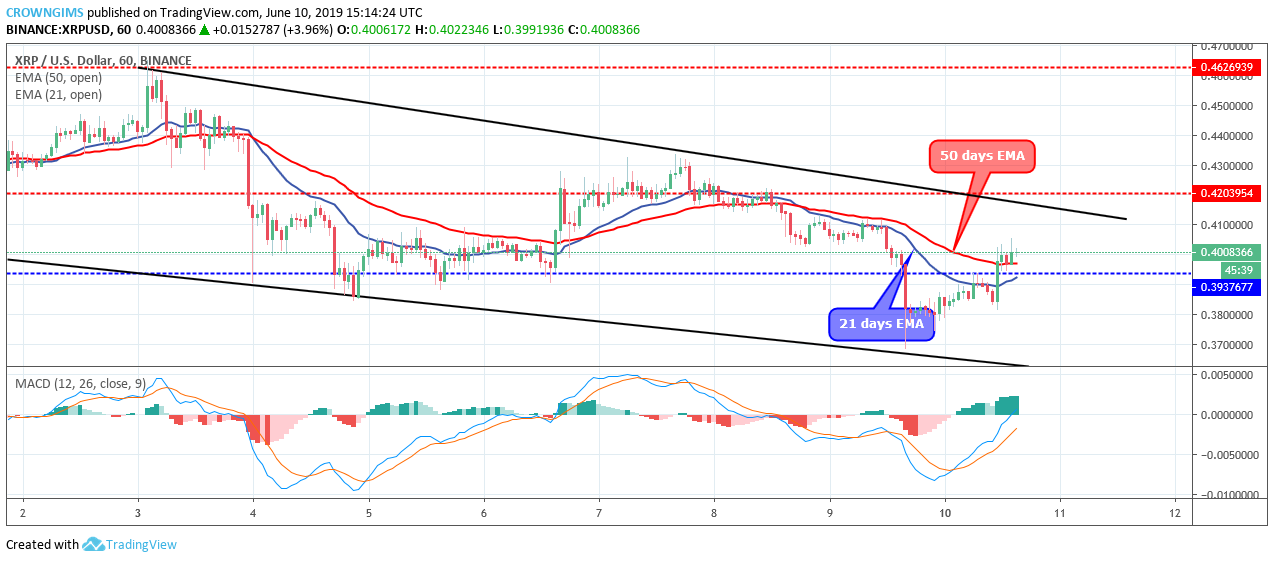
On the medium-term outlook, XRP/USD is Bullish. XRP price has crossed over the two dynamic support and resistance as a sign of bullish movement. The price bounced at the lower trend line of the channel and the Bulls were able to increase their pressure, the price is currently rallying towards $0.42.
A Further increase in the XRP price is highly envisaged. The histogram of Moving Average Convergence Divergence period 12 is above zero level and the signal line pointing up which connotes buy signal. As at the moment XRP price is trading above the 21 periods EMA and 50 periods EMA on the 1-hour chart.


