

Supply levels: $230, $238, $248
Demand levels: $214, $204, $196
ETH/USD Medium-term Trend: Ranging
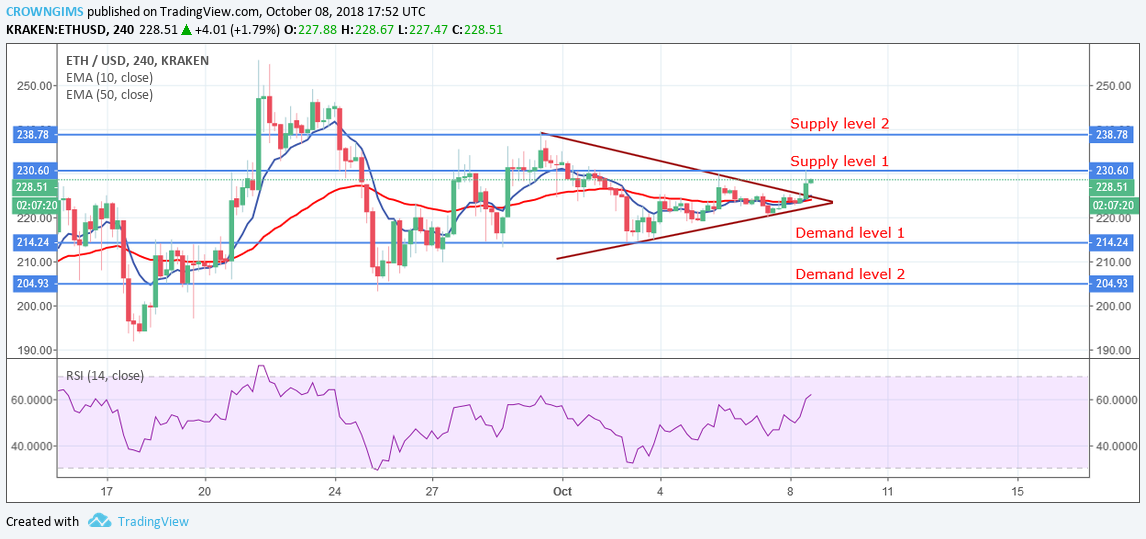
The strong bullish momentum pushed the coin to a higher supply level of $238 on September 30. It was rejected by the seller’s pressure by the formation of bearish inside bar candle and the price decreased to the demand level of $214. Rejection of downward continuation is seen at the demand level with strong bullish candles which are the sign of bearish exhaustion and ETH started consolidation.
ETH remains in consolidation and trading between the supply level of $230 and the demand level of $214. Traders should be patient for either a breakout at the upper supply area or a breakdown at the lower demand before taking a position. ETH may move higher today in case the bulls increase their pressure.
Price is above the 10-day EMA and 50-day EMA with the RSI 14 above 60 levels and it signal lines points upward, which indicates an upward movement. The price may resume its radical uptrend movement as it has formed an ascending triangle and the price has broken the upper trend of the ascending triangle.
ETH/USD Short-term Trend: Ranging
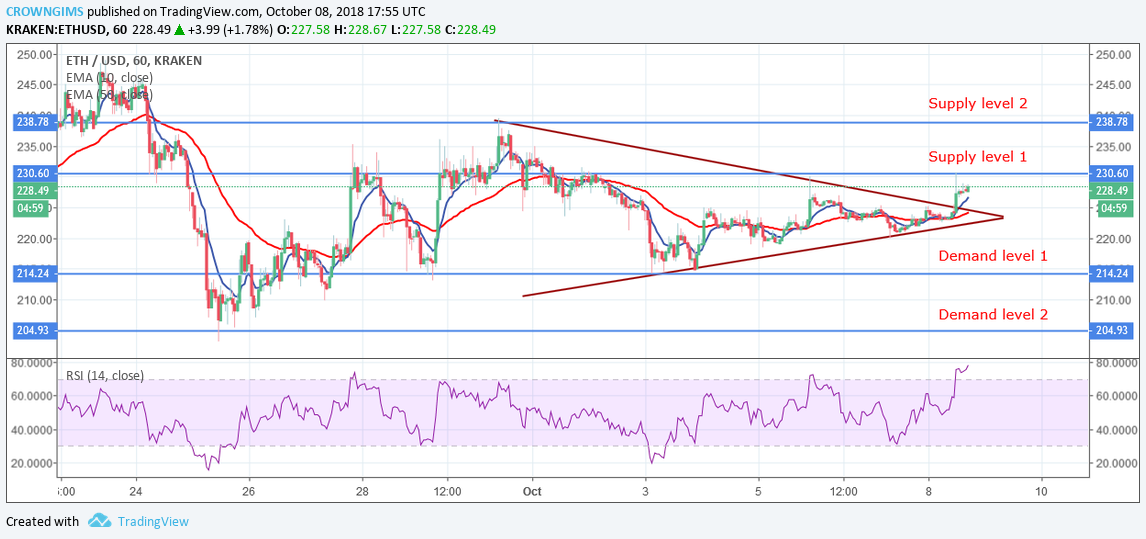
ETH/USD made a bearish run to the demand level of $214, bulls rejected the price to the upward movement with the formation of a bullish engulfing candle as the bulls made a gradual return to the north above the demand level of $214.
The coin started moving sideways within the range bond of supply level of $230 and the demand level of $214 yesterday, due to the weak pressure from the buyer and the seller. Meanwhile, ETH has formed an ascending triangle pattern which indicates uptrend movement. The price has broken the upper trend of the triangle moving towards the supply level of $230, should the price break the supply level, the strong bullish movement will be experienced.
The Price is above the 10-day EMA and the 50-day EMA below the 10-day EMA. The RSI 14 is above 70 levels with its signal lines pointing upward which indicates the possibility of uptrend movement.
, and Stellar (XLM) Price Analysis – Recovery Expected Above Major Support Levels")
 and Stellar (XLM) Weekly Price Performance Overview")
