
 Technical Analysis #001 - Short Term Rebound As Litecoin Makes Fresh 6 Month Lows")
Litecoin has continued its downward trend falling a further 17.74% over the past 7 days. The cryptocurrency currently is trading hands at a price of $80.65 as it battles to stay above $80 at the time of writing.
Litecoin was created in October 2011 by ex-google employee Charlie Lee. Lee set out to create a cryptocurrency that was “lighter” than Bitcoin and thus created Litecoin. If Bitcoin would be compared to gold then Litecoin was intended to be silver.
Litecoin can boast faster transaction speeds and lower speeds. It already has tech far superior to Bitcoin with the SegWit activated and Atomic Swaps already in the pipeline.
The cryptocurrency has suffered a terrible month falling 28.72% in the past 30 trading days. The crypto giant is currently in the top 10 ranked cryptocurrencies in terms of market cap, sitting at 6th rank with a total market cap of $4.61. This is down by a total of $1 billion from the high market cap of $5.63 billion seen last week on June 21st.
Let us analyse price action over the course of the year and see how the market has been trading.
Price Analysis
LTC/USD – LONG TERM – DAILY CHARTS
https://www.tradingview.com/x/rAV8sK2U/
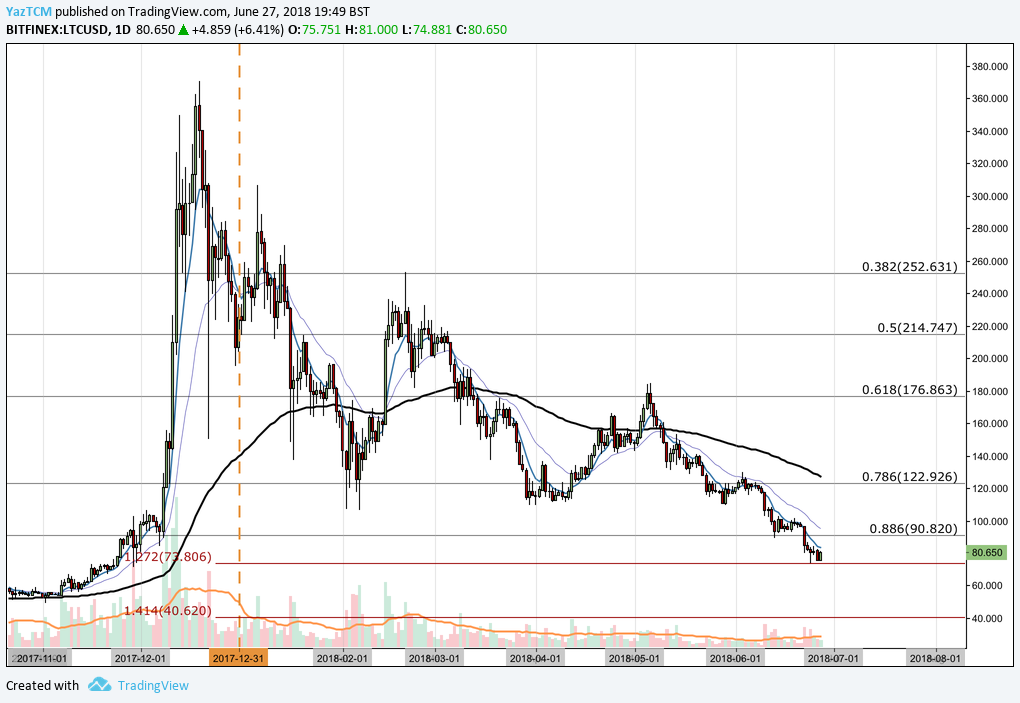
Analysing the chart above, we can see that Litecoin had experienced an incredible bullish run during the months of November 2017 and December 2017 as price action rose from a low of $49 in November to a high of $370 in December. This was an extraordinary price increase of 730% from low to high.
After the placement of this high, we can see price action went on to depreciate throughout the year, largely staying above $120 near the .786 Fibonacci Retracement priced at $122.92. This is a Fibonacci Retracement taken from the bullish run seen during November 2017 and December 2017.
Price action went on to break below this price level during the current month of June. The bearish pressure, witnessed throughout the entire industry, pushed the market further below $100 until it briefly found support at the .886 Fibonacci Retracement at a price fo $90.82.
However, the bears were still positioned strongly within the market and continued to push prices even lower to where they currently trade at fresh 6 month lows. We can see that price action has currently found support at a 1.272 Fibonacci Extension level marked at a price of $73.80. This is a Fibonacci Extension taken from the all time high seen in December 2017 to the low witnessed on January 17th at $137.
If the market can manage to stay above this level and the bears begin to subside with their bearish pressure, then this would allow the bulls to push the market back above the .886 Fibonacci Retracement and eventually above near term psychological resistance at $100. A break above $100 would leave the market free to retest June’s monthly highs around $129. Resistance following this level is located at the .618 Fibonacci Retracement at a price of $176, this is also May’s monthly high.
Let us analyse price action over the more recent period a little closer.
LTC/USD – SHORT TERM – DAILY CHART
https://www.tradingview.com/x/b6M97Pd4/
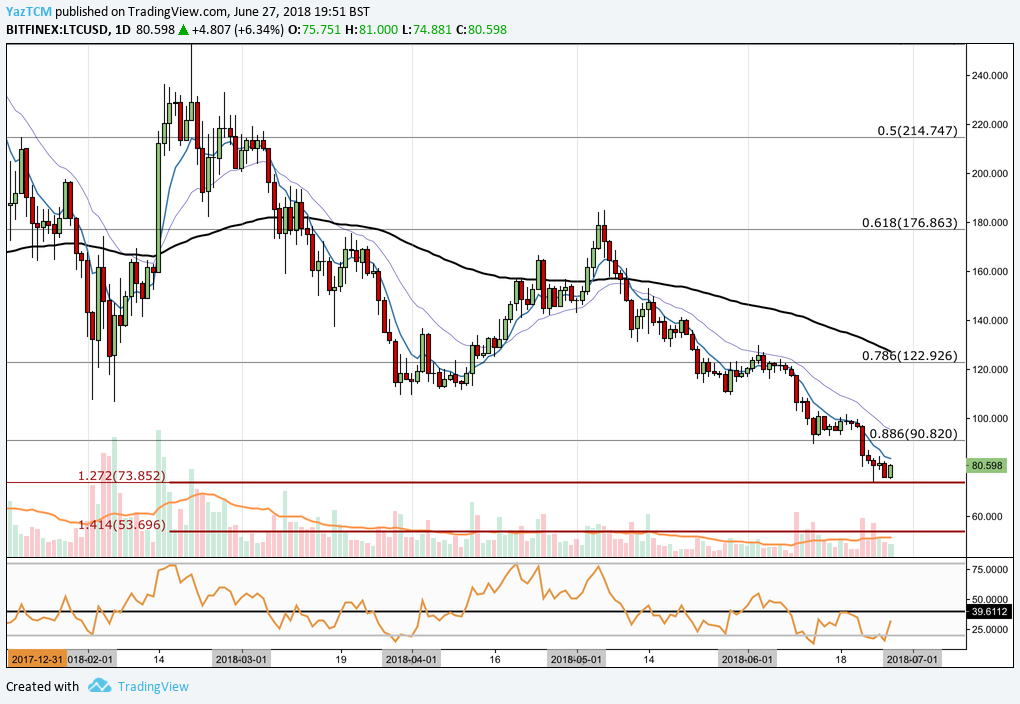
Looking at the market from a more near term perspective, we can see that the previous long term 1.272 Fibonacci Extension mentioned above also coincides with another short term 1.272 Fibonacci Extension adding to the validity of support expected to be found in this area.
The short term Fibonacci Extension, marked in dark red at a price of $73.85, is taken from the high of $252 seen in February to the low of $109 experienced in March.
If the bears manage to push the market below the short term 1.272 Fibonacci Extension, then the market will continue to make fresh multi-month price lows as Litecoin depreciates in value.
The closest level of expected support following a break of $73.85 is the short term 1.414 Fibonacci Extension marked at a price of $53. Support further lower following a break of $50 can be found at the long term 1.414 Fibonacci Extension at a price of $40.62.
The technical indicators are largely favouring the bears in this scenario. However, the RSI indicator looks to be making its way back toward the 50 handle which could indicate that the bearish pressure is beginning to fade. For a confirmation of this, we will look for the RSI to break above the 50 handle.

