

Distribution Territories: $0.024, $0.026, $0.027
Accumulation Territories: $0.022, $0.020, $0.018
TRX/USD Long-term Trend: Ranging
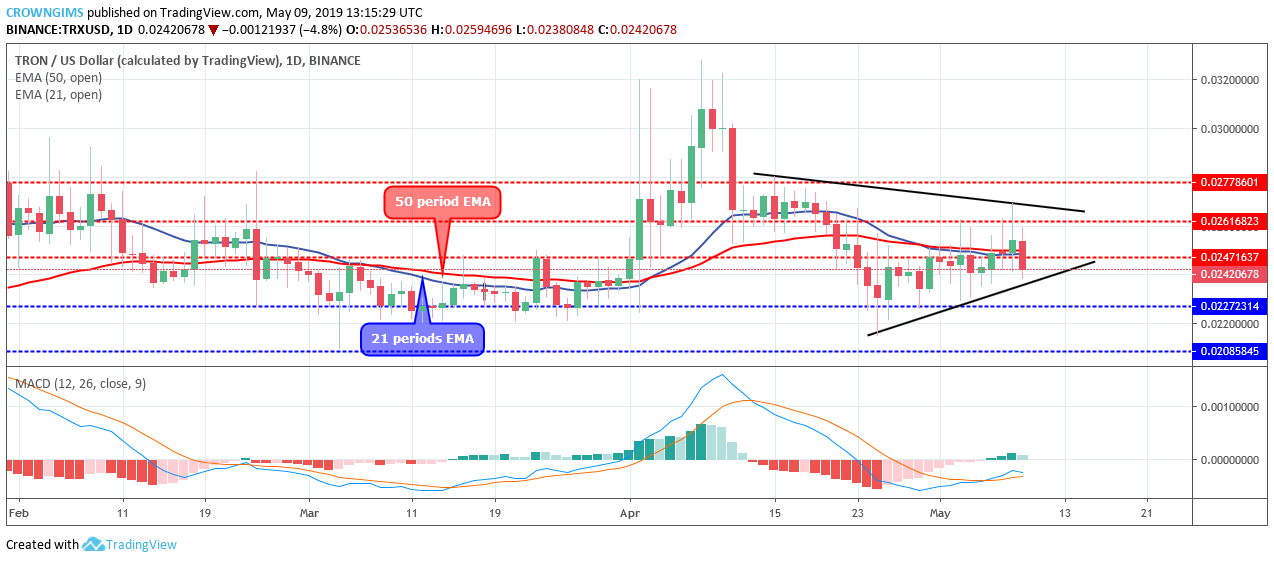
TRX/USD is on the sideways movement on the long-term outlook. The Bulls had propelled the coin towards north to break up the $0.024, $0.026 and $0.027 price levels; this terminated the long period consolidation experienced by the Tron between the month of March and April.
A Doji star candle pattern was formed which signaled to the market the arrival of the Bears. A strong and massive bearish candle emerged which broke down the $0.027 and $0.026 level. The coin consolidated for few days, later the bearish pressure was exerted and the barriers at $0.026 and $0.024 could not hold and the price dropped to $0.022 level before it was retracted to $0.024 level where it started sideways movement.

A daily strong bearish candle formed today is currently pushing the price towards $0.022 level which is an indication that bearish trend may continue in the Tron’s market.
In case the Bears increase their momentum, bearish trend will continue and the coin may have its support at $0.022 – $0.020. The 21 periods EMA and 50 periods EMA are interlocked to each other while the coins trading over the two EMAs as a sign of consolidation.
Meanwhile, the Moving Average Convergence Divergence period 12 is gradually fading out above the zero levels and the signal lines trying to bend down indicate that the Bears may soon take over the market on the daily chart.
TRX/USD Medium-term Trend: Bearish
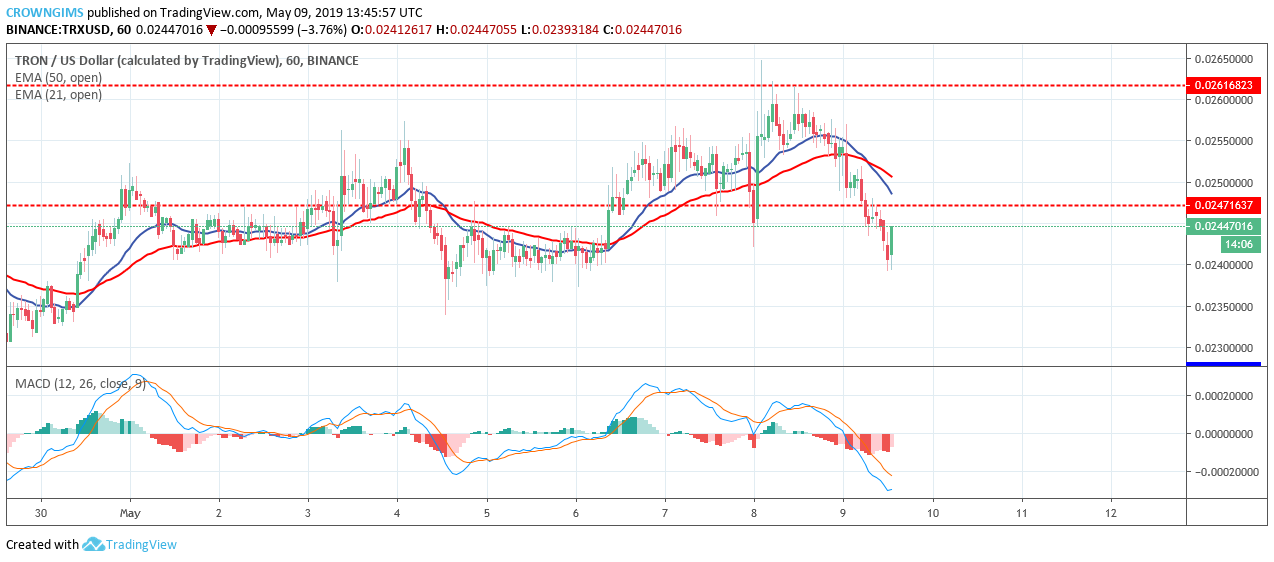
TRX/USD is bearish on the medium-term outlook. The bulls were unable to continue their uptrend movement at $0.026 level due to the barrier at the level and the weakness of the bullish momentum. The bears then gathered momentum and pushed the TRX price down below the $0.024 level.
The coin is already trading below the 21 periods EMA and 50 periods EMA and the two EMAs are bending down as a strong bearish signal. In addition, MACD period 12 is below zero levels with its histogram and the signal line bending down to connotes sell signal.

