
 Price Analysis - February 13")
Supply Zones: $48, $52, $55
Demand Zones: $42, $37, $34
LTC/USD Medium-term Trend
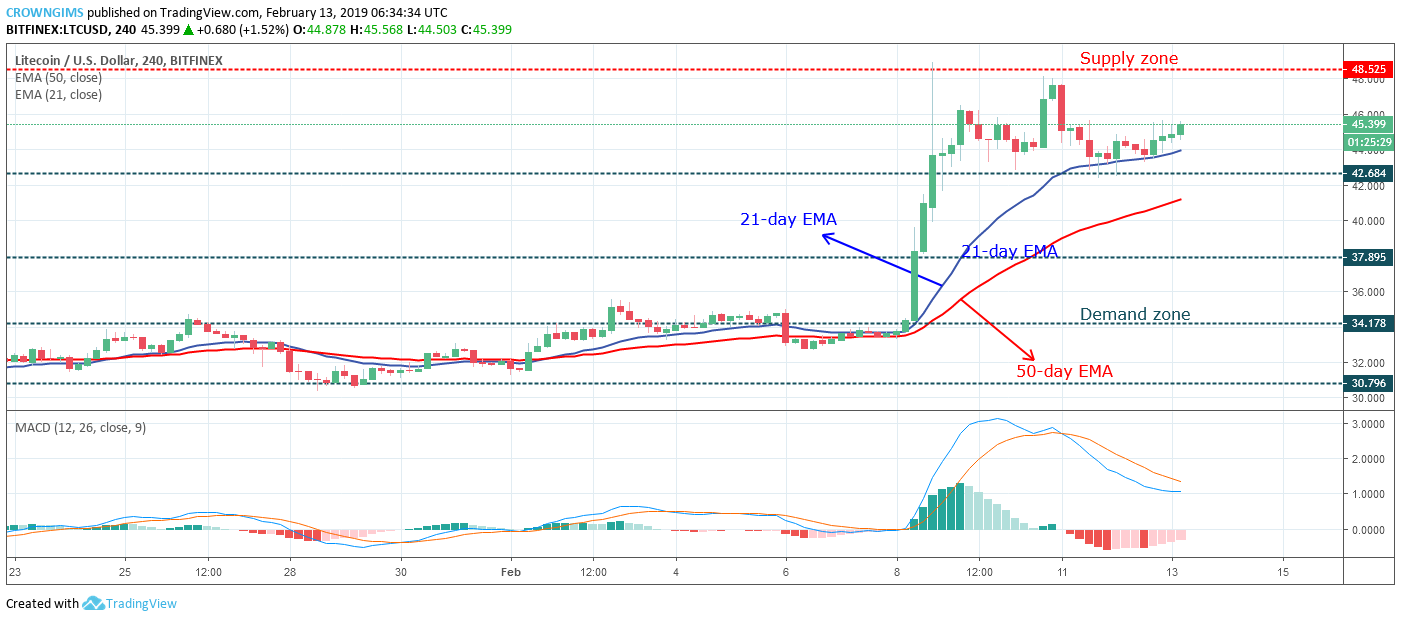
On the medium-term outlook, LTC/USD is on the bearish trend. Before February 8, LTC price has been fluctuating within the range of $34 and $30 price level. This ranging movement persisted for more than two weeks.
There was a bullish sporadic movement of the LTC price which penetrated the $37, $42 former supply zone and moved towards the supply zone of $48 where a further increase was rejected by the bears. The LTC price was returned to the $42 price level to retest the broken level. It is currently recapitulating its ranging movement which may have its target at $40 – $37 price level.

The 21-day EMA and 50-day EMA are well fanned apart as evidence of a bullish trend, LTC is currently facing the Supply zone of $48 and it is trading above the 21-day EMA and 50-day EMA. The Moving Average Convergence Divergence (MACD) period 12 with it histogram below the zero levels and the signal lines above zero level bending to the north indicate the continuation of the bullish trend in the LTC market.
The bullish trend can come in if the bulls can increase its momentum, break the supply zone of $48 and the bullish candle close above the mentioned price level, then LTC price may have $52 price level as its target.
LTC/USD Short-term Trend: Ranging
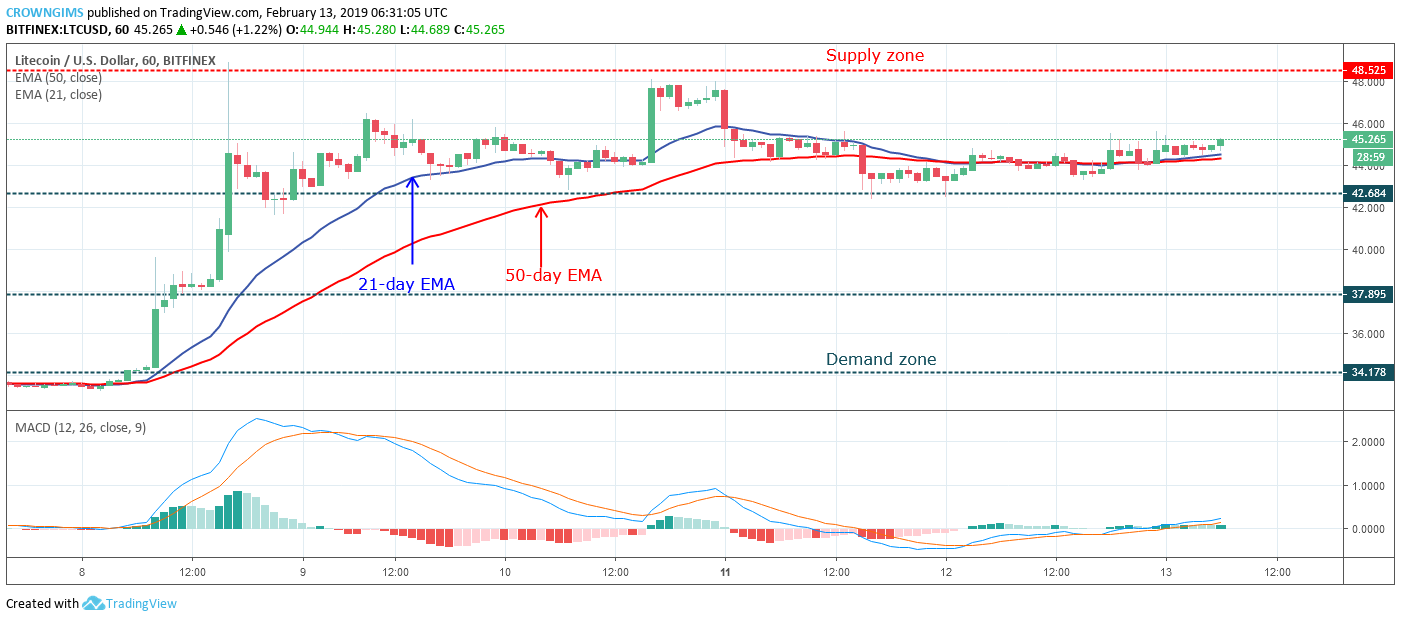
LTC/USD is on the ranging movement on the short-term outlook. The bulls and the bears’ momentum were at equilibrium not quite long after the LTC price rallied to the north side on the February 8 and it topped at $48 price level. The coin broke up many barriers like $37 and $42 former supply zone. The LTC price is consolidating in between $42 demand zone and $48 supply zone.
The two EMAs were interlocked to each other, horizontally flat and the LTC price is hovering over the 21-day EMA and 50-day EMA which indicates that consolidation is ongoing. The break out is imminent, the traders should be patient and remain flat until the clear cut break out is seen in the LTC market on 1-Hour chart.
In addition, MACD period 12 with its histogram and signal lines are flat on the zero level which indicates that consolidation may continue for a short period of time.

 Price Up 62% From Bottom, Can The Bulls See More Gains?")
