

Waves has seen a small price decline totalling -1.7% over the past 24 hours of trading. The cryptocurrency is currently exchanging hands at a price of $1.96 after seeing a further -2.2% price decline over the past 7 trading days.
Waves is a well established blockchain based decentralised exchange platform that allows users to also create custom tokens in a user friendly fashion. More so, the Waves platform already has fiat gateways allowing users to invest US Dollars and Euros into the platform.
Waves is currently ranked in 44th position in terms of overall market cap across the entire industry. It currently holds a total market cap value of $195 million after the 29 month old cryptocurrency suffers a 27% price drop over the past 90 trading days.
Waves is still trading at a price that is 88% lower than its all time high value.
Price Analysis
WAVES/USD – SHORT TERM – DAILY CHART
https://www.tradingview.com/x/cQWE77V8/
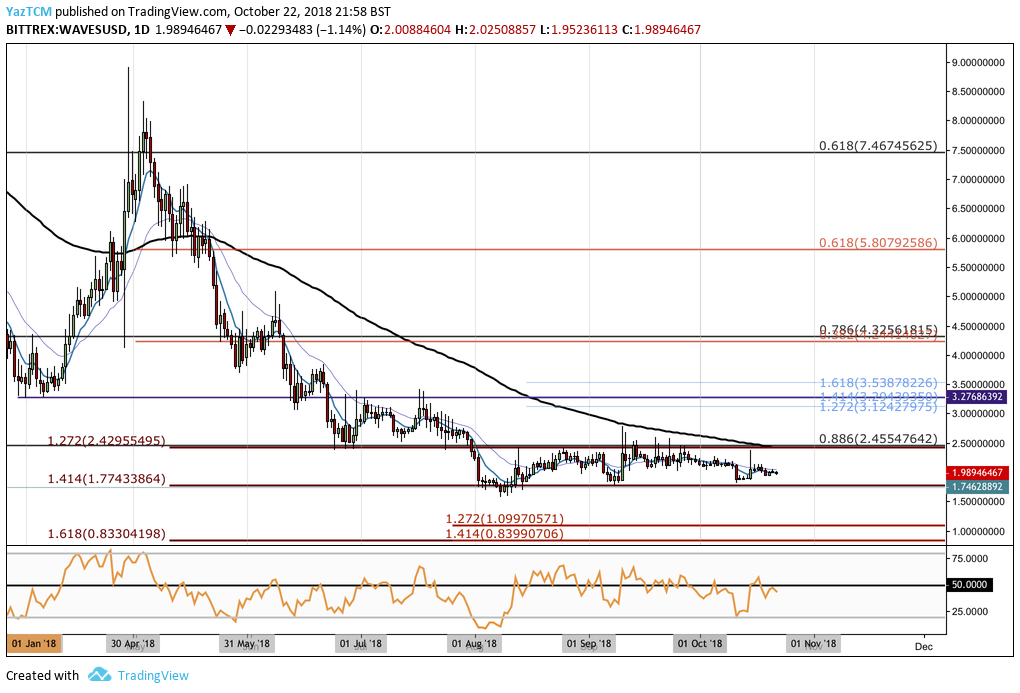
Analysing price action from the short term perspective above, we can see that Waves has been trading in a long, well established, trading range bound between a downside 1.272 Fibonacci Extension level priced at $2.4955 as the upper boundary of the range and a downside 1.414 Fibonacci Extension level priced at $1.7733 at the lower boundary of the trading range.
We can see that price action has been trading within the confines of this range for the past 2 and a half months now as both the bulls and the bears struggle to gain a foothold within the market.
Moving forward, if the bulls manage to accelerate their momentum and push price action higher they will meet initial significant resistance at the upper boundary of the trading range priced at $2.49. This area of resistance contains the downside 1.272 Fibonacci Extension level as well as the long term .886 Fibonacci Retracement level further bolstering the level of resistance within this area. To make this harder for the bulls, the 100 day moving average is also hovering within this price level further adding to the level of expected resistance here.
If the bulls do manage to push price action above the combined resistance at $2.25 then further higher resistance can be expected at the short term 1.414 Fibonacci Extension level (drawn in blue) priced at $3.29. This price level was the price low and support during March 2018 and is expected to provide resistance moving forward. Higher resistnace above this can then be located at the long term .786 Fibonacci Retracement level priced at $4.32.
Alternatively, if the bears regather momentum and push price action lower then initial support will be located at the lower boundary of the trading range priced at $1.77. If the bears can push the market below the confines of the trading range we can expect immediate support below at the psychological round number handle at $1.50 followed by the short term downside 1.272 Fibonacci Extension level priced at $1.09.
The technical indicators within the market are currently slightly favouring the bears at this current moment in time. The RSI has slipped below the 50 handle indicating that there could be more negative price movements ahead as the bears are in control of the market. If we are to expect the market to break above the upper boundary of the trading range we would need to see the RSI break above the 50 handle.


