VeChain (VET/USD)

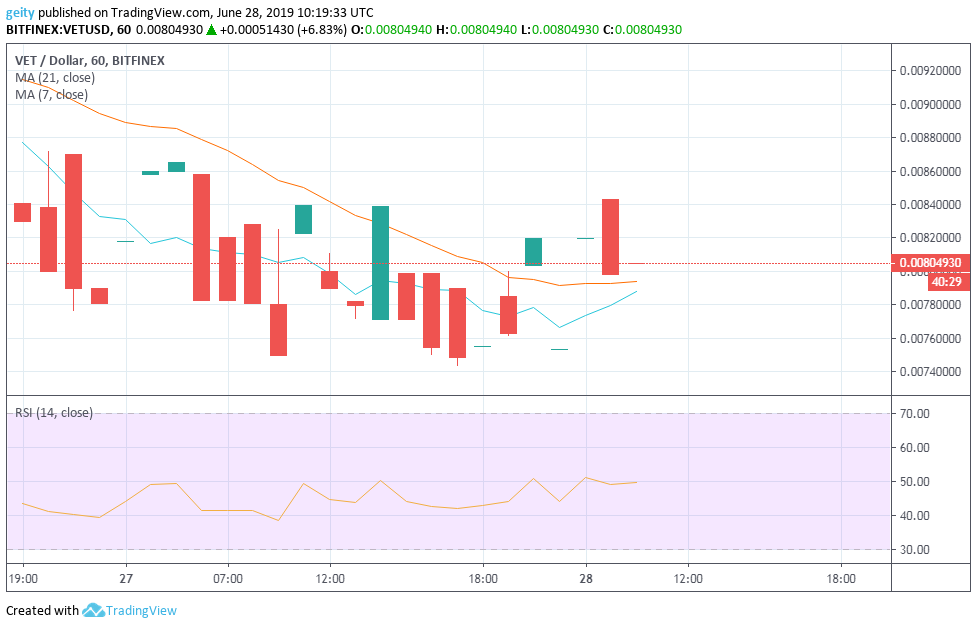
VET/USD pair has exhibited a bearish run over the last 24hrs. VET coin down by 3.13%, having moved from $0.00830 to 0.00804. The coin has turned from green to red that indicated a bearish signal. The downward price movement has been supported by the 21-day moving average that was seen gravitating above the 7-day moving average.
The Relative Strength Index indicator was been trading between level 60 and 30 that indicated a lack of momentum in the market. Additionally, the presence of a four-price Doji is seen within the chart thus indicated that the market was dealing with a very small number of transaction in the last 24hrs.
FORECAST
At the moment the 21-day MA is above the 7 day MA which signals a bearish signal. However, if the bulls up their move, the bearish rally can be subdued. Seeing that the 7-day MA is heading north and is almost crossing the 21-day MA. New price point should be set at $0.00808.
Chainlink (LINK/USD)

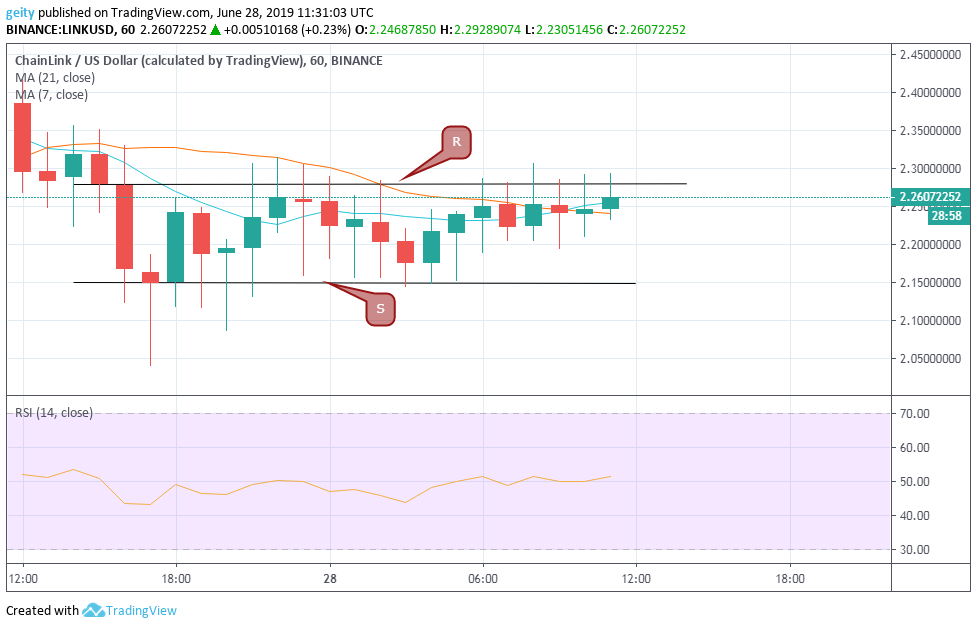
Like VET, LINK/USD pair has also experienced a bearish outlook. LINK began trading with a bearish rally that dipped sharply to a low of $2.26072. This placed new resistance at $2.27844 and support at $2.14823. Apparently, both the resistance level and support level was tested severally.
The pair’s price has taken a positive turn in the last few hours and is now up by 12.43%. Its Relative Strength Index indicator has been trading between the level of 60 and 40, which indicated a lack of strong momentum in the market. The earlier slip in LINK’s price shows investors are looking forward to going short.
FORECAST
A significant price hike is likely to be seen in the next few hours. This is because; at the moment the 7-day MA has crossed over the 21-day MA thus indicating incoming bullish signal. New targets should be filled at $2.68.
Tezos (XTZ/USD)

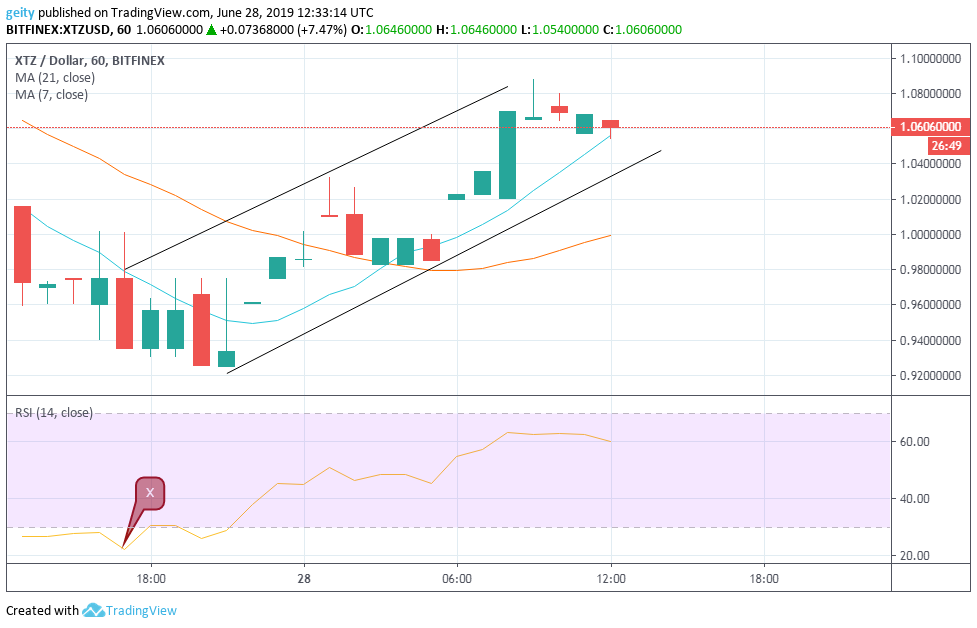
Unlike VET, XTZ has exhibited a bullish outlook over the last 24hrs. The candle has turned green from red which indicated a bullish outlook. The upward price rally has been confirmed by the 7-day moving average that is currently above the 21-day moving average.
XTZ/USD held up gains over 8.2% since it began trading at $0.972940 where it moved up to $1.06060. This showed a bullish rally that is also reflected by the ascending channel. The coin seems to have continued the positive growth as market analysts anticipated a few days back.
The Relative Strength Index X was initially seen below level 30, which indicated an oversold market momentum. The RSI then moved from level 21.52 to 63.59 thus indicated increase buyouts.
FORECAST
Currently, the RSI indicator is pointing towards south, this shows that the market may encounter a bearish outlook on its ascending channel. New price targets will be confined within the channel with a bearish outlook putting the price at the range $1.0400 to $1.0600.


