An advantage we have when investing in crypto over other assets, such as stocks, is absolute transparency. Public companies that trade in the stock market are required to present quarterly reports with the current state of the business. In that way, 4 times a year, investors receive an update of how the business is doing and can make decisions accordingly. In crypto, and Bitcoin specifically, those updates are reported in real-time.
Every transaction, every wallet created and all their balances are publicly recorded on the blockchain. Anyone can access that information free of charge through a block explorer. On top of that, there are websites that process all that information and produce easy-to-read metrics and charts that can tell us a lot about the state of the network. In this article, we are going to present the 2 best Bitcoin On-chain metrics that can help us predict future price tendencies.
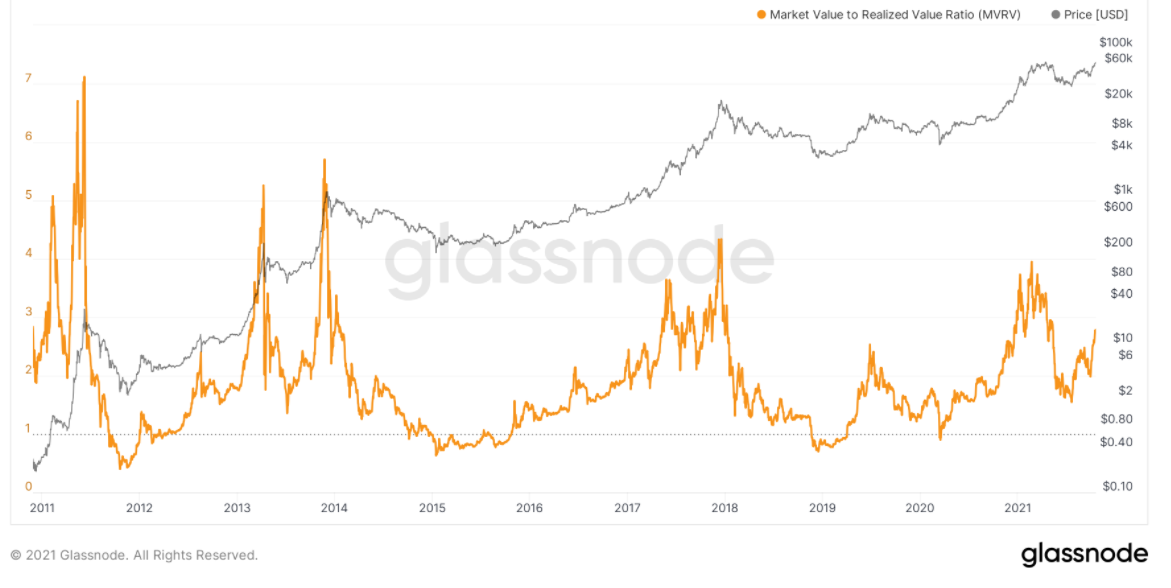
- Market Value to Realized Value (MVRV)
This metric is a ratio of Bitcoin’s Market Capitalization versus its Realized Capitalization. Let’s dive into these concepts. The market cap is the total value of an asset, it results from the product of the circulating supply vs the last trading price.
A simplified version of bitcoin’s market cap would be the following:
20.000.000 coins in circulation * 40.000 USD per coin = 800.000.000.000 USD

The realized cap is similar, but it values each coin at the price it was last moved. So if you bought 1.5 BTC at 10.000 in 2020 and haven’t moved it since, those coins would only add 15.000 USD(1.5 * 10.000) towards Bitcoin’s realized cap instead of 60.000(1.5 * 40.000 assuming a Bitcoin price of 40k). This technique reduces the impact of lost or dormant coins that have not moved for years, resulting in a more realistic valuation of the asset.
So the MVRV = market cap / realize cap.
High MVRV values: it happens then the market cap is significantly higher than the realized cap. This means a lot of investors have unrealized gains, it stands to reason they will soon sell their coins to realize the gains and drive the price lower.
MVRV higher than 3.5 usually indicated a market top.
Low MVRV values: the opposite happens, it means that most investors hold low profit or even unrealized losses. This tends to indicate the asset is undervalued and is at good buying zone.
MVRV lower than 1 has been a good indicator of a market bottom.
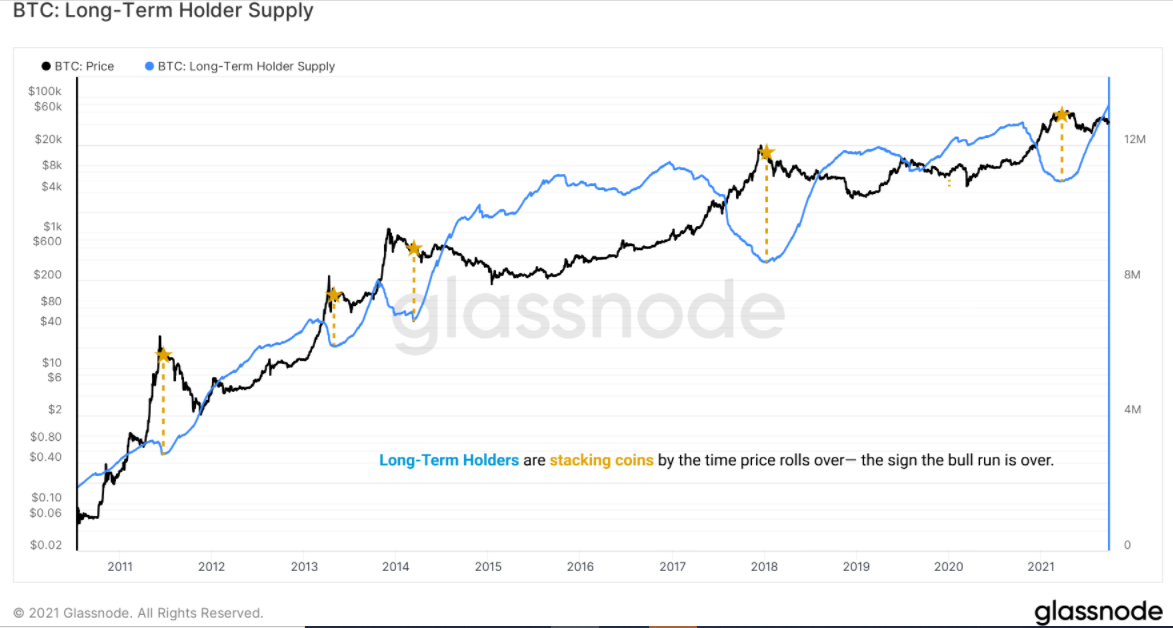
- Long-Term Holder (LTH) Supply
According to glassnode, a coin is added to the long-term holder list when it remains dormant for more than 155 days or approximately 5 months. By tracking the number of coins held long term and their behavior, we can follow the smart money. Usually, when prices start to increase, the LTH will begin selling their coins to newcomers. Eventually, the demand can’t keep up and prices start to fall. This is when smart money starts to accumulate again.
So usually, when we see the LTH supply growing it means the top is in and the bull run may be over. On the contrary, when the LTH supply starts dropping it could mean the beginning of a price rally.