
 Price Prediction and Analysis")
XLM/USD
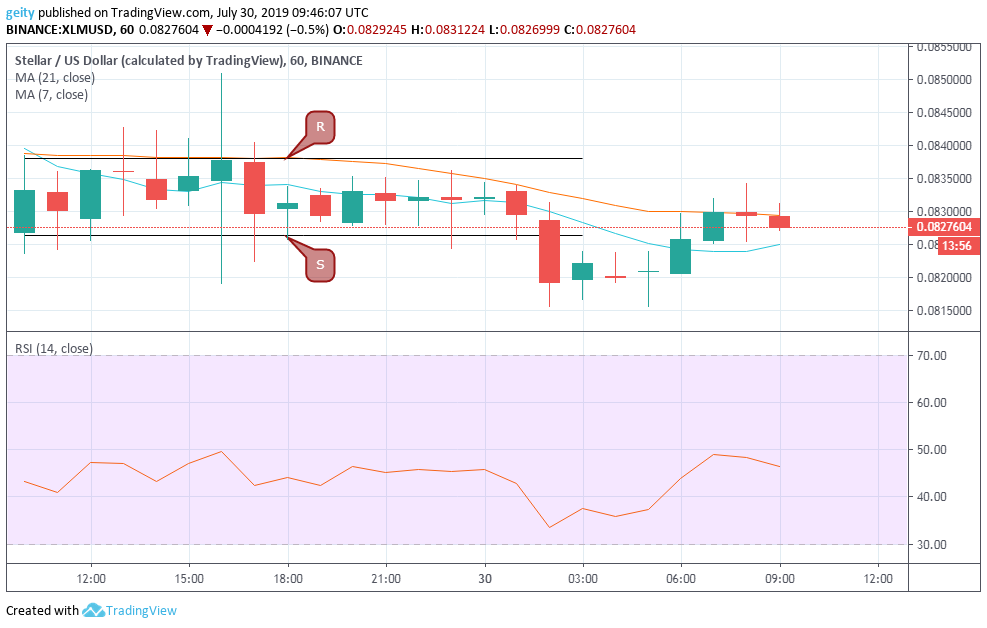
XLM/USD pair began trading at $0.08332 and is now at $0.08276 that translated to a dip of 0.67% over the last 24hrs. The bearish pressure seemed to have been supported by the 21-day MA that gravitated above the 7-day MA throughout the intraday outlook. The RSI indicator was also seen hovering between 40 and 60 from 10:00 to 01:00 that signaled a lack of momentum in the market.
Additionally, the sideways price movement defined the resistance level at $0.08332 and the support level at $0.08264. However, the support level was breached and lowered down to $0.08194 that showed a downward pressure. Investor’s sentiments later rose slightly and pushed the price up to the current price rate of $0.08276. The RSI indicator is now heading south that signals increase in sellouts.
Forecast
Currently, all the indicators are pointing towards a further downtrend. The 21 day MA is still hovering above the 7 day MA. The RSI is heading south that signals more bearish pressure. New targets should be set at $0.08150.
EOS/USD
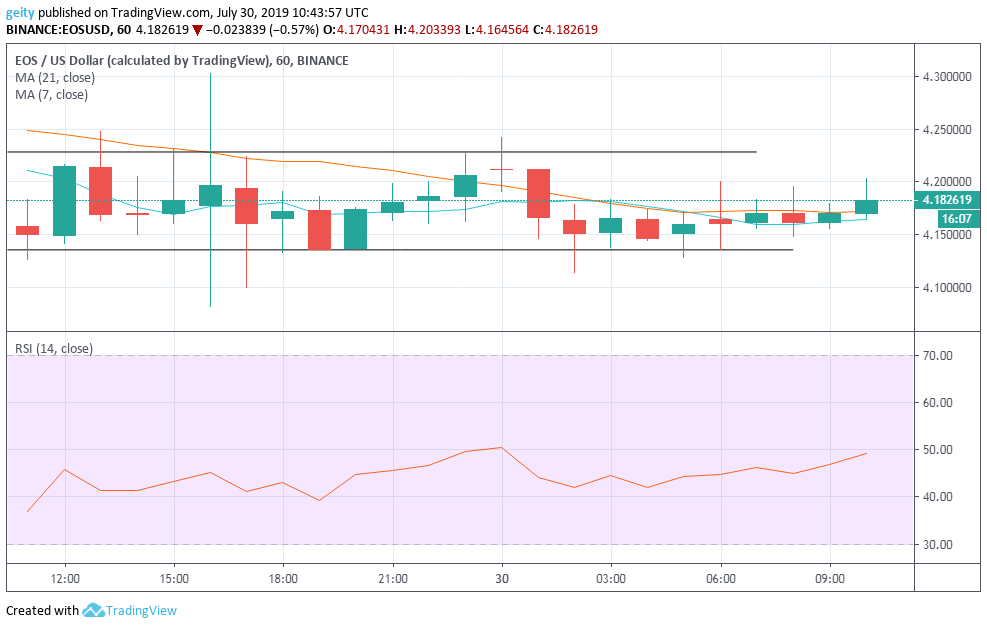
Unlike XLM, EOS/USD pair has slightly gained by 0.78%. EOS began trading at $4.15 and is currently trading at $4.18. Despite a generally bearish outlook as indicated by the 21 day MA that is currently above the 7 day MA. The slight recovery was supported by positive investor’s sentiment that was seen in the RSI indicator that is at the press time, heading north.

Presence of a Doji is seen at several instances that indicated indecision in the market. The horizontal channel signaled a sideways trend. The RSI indicator was seen hovering between level 40 and 60 that indicated a lack of momentum in the market. The RSI is at the moment heading north that showed positive investors sentiments thus increase in buyouts.
Forecast
The RSI indicator is heading north that indicates incoming Bullish outlook. If the price breaches the upper channel that is at $4.22, then investors could go long and take advantage at $4.30.
(XRP/USD)
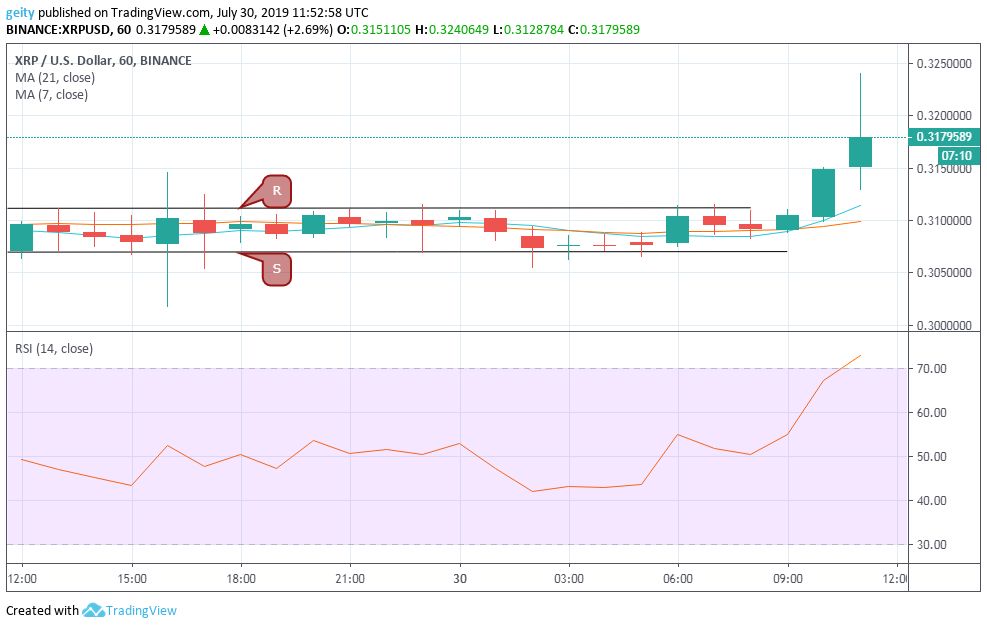
Like EOS, XRP/USD pair is impressively up by 2.6% over the last 24hrs. XRP saw a medium-term period of consolidation between the critical resistance level $0.3112 and support level $0.3069 before a breakout that later pushed the price momentum up to a high of $0.3241.
The market began trading at $0.3095 and is currently at $0.3179, this showed price improvement throughout the intraday. The upward pressure was thereby supported by the 7 day MA that is currently seen above the 21 day MA that signaled a bullish pressure.
The RSI indicator also gained momentum since it broke level 60 and further climbed upwards past the overbought zone that is level 70. That showed an increase in buyouts due to the rise in investor’s sentiments.
The RSI indicator currently indicates, the unwillingness of investors to go short while holding on to XRP holdings in anticipation for better prices.
Forecast
Currently, all indicators foresee better prices in the coming day. The 7 day MA is seen above the 21 day MA, and the RSI is heading north that signals a bullish pressure, new breakout target should be set at $0.3350.


