
 Technical Analysis #005 - Ripple Breaks Above the $0.30 Handle With a 17% Rally")
Ripple has seen a 17.91% price increase, at the time of writing, over the past 24 hours of trading. The cryptocurrency is now exchanging hands at a price of $0.3241 as the cryptocurrency skyrockets above the $0.30 handle once again. Ripple has now seen a 23.76% price increase over the past 7 trading days.
There has not been much news into why the Ripple token may have rocketed, although some have speculated that a huge announcement may be incoming, possibly relating to the addition of Ripple into Coinbase. This would greatly add to the argument that Ripple has the ability to decouple from traditional Bitcoin price movements.
Ripple still holds the number 3 rankings in terms of overall market cap across the entire industry. It currently has a total market cap value of $12.90 billion bringing the total 90 day trading price drop up to only -39.78%. Ripple is now trading at a price that is total of 91% lower than its all time high price.
Let us continue and analyse price action for Ripple over the short term and update any potential support and resistance areas.
Price Analysis
XRP/USD – SHORT TERM – DAILY CHART
https://www.tradingview.com/x/MIq9VOJd/
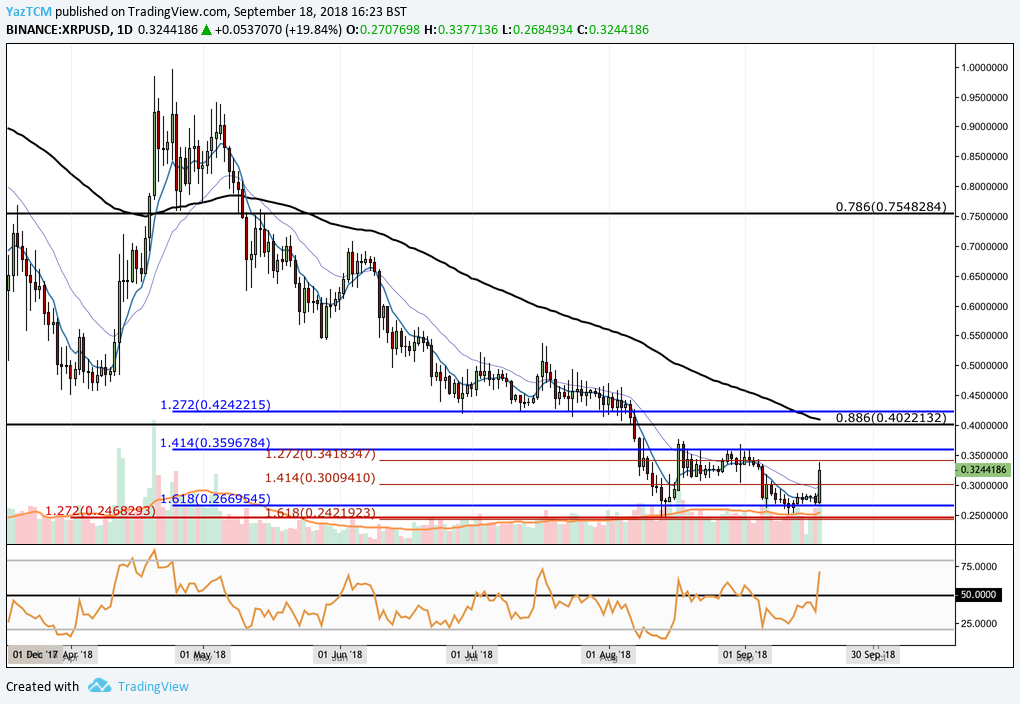
Analysing price action over the long term we can see that price action has developed since our last technical analysis piece on XRP. We can see that our highlighted support level at the downside 1.618 Fibonacci Extension level (drawn in blue) priced at $0.2669 held as it continued to support the market throughout the market bloodbath seen in September 2018. This price level also happened to be the price level where the market rebounded from today.
We can see that the 17% price increase has caused the market to break back above the $0.30 and continued until resistance was met at the previous short term downside 1.272 Fibonacci Extension level (drawn in red) priced at $0.3418. As price action touched this level the bulls met some resistance and the market began to retrace slightly.
Analysing the market over the past two months, it is apparent that the Ripple market has established a trading range bound between the downside 1.414 Fibonacci Extension level (drawn in blue) priced at $0.3596 as the upper boundary and the downside 1.618 FIbonacci Extension level (drawn in blue) priced at $0.2660 as the lower boundary of the trading range.
If the market can continue to rally above the resistance level priced at $0.3418, we expect further significant resistance above to be located at the upper boundary of the range priced at $0.3596. If price action can break above, then further resistance higher can be located at the long term .886 Fibonacci Retracement level priced at $0.40. This area of resistance will be bolstered by the 100 day moving average which is currently hovering at the same price level.
Alternatively, any negative price pressure is expected to be supported by the lower boundary of the trading range priced at $0.2660. If price action can penetrate beneath this level then further support below can be expected at the downside 1.618 FIbonacci Extension level (drawn in red) priced at $0.2419.
The technical indicators within the market have recently swung into the favour of the bulls as the RSI breaks well above the 50 handle. This indicates that the bulls are in total control of the momentum within the market. So long as the RSI reaminas above the 50 handle we can expect this market to continue to make further gains.


