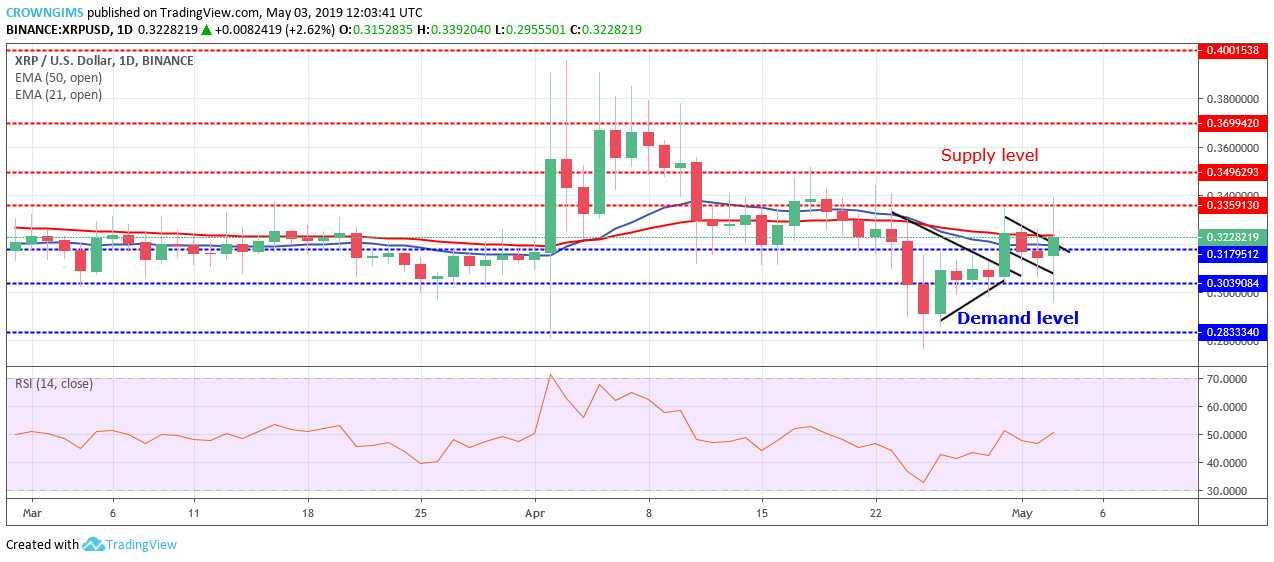
Supply zones: $0.33, $0.34, $0.36
Demand zones: $0.31, $0.30, $0.28
XRP/USD Long-term Trend: Bullish

XRP/USD is bullish on the long-term outlook. On April 18, there was a formation of the bearish reversal candle pattern called evening star candle pattern at $0.33 price level. It gave the Bears momentum to drive the coin down the lower price. XRP price was pushed down to break $0.31, $0.30 and later find support at $0.28.
Another significant candle pattern was noticed at $0.28 price level and this is called bullish engulfing; this is a bullish reversal type and that is what moved the XRP price up to $0.33 on April 30. On May 02 and May 03, the coin flagged down towards $0.30 level. Today, a bullish candle emerged that broke up the flag and moved the price up to $0.33 level before the Bears pushed down the price back to $0.31 level.
XRP price is currently in-between the 21 periods EMA and 50 periods EMA and the two EMAs are close to each other which indicate that sideways movement is ongoing in the XRP market.
The Relative Strength Index period 14 is at 50 levels with the signal line pointing up to indicate a buy signal. The Bulls are taking over the XRP market gradually. In case the Bulls maintain or increase their pressure, XRP price may reach $0.34 level provided $0.33 level does not hold. In case $0.33 level holds, the price may range back to $0.31 level.
XRP/USD Medium-term Trend: Bullish

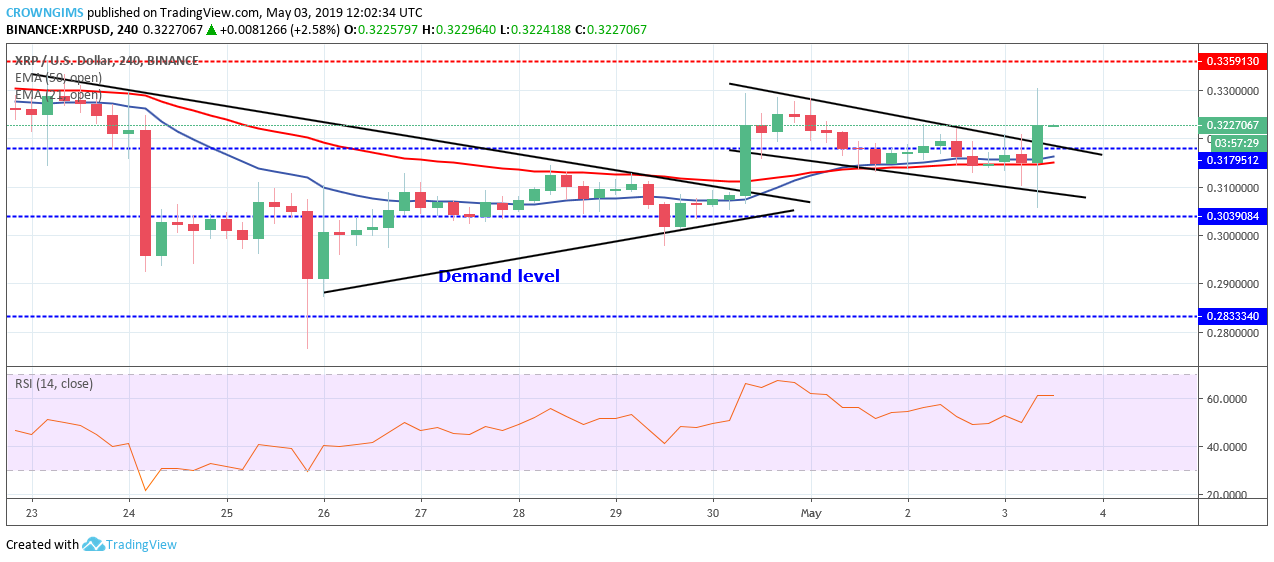
On the medium-term outlook, XRP/USD is Bullish. The crypto resumed bullish movement after the consolidation that took place within the symmetrical triangle formed on April 26 – 30 at $0.30 price level.
A strong bullish candle emerged and broke up the two dynamic resistance levels and the $0.31 price level. XRP moved towards $0.33 but unable to reach the level before the Bears opposed the increase in price.
A price retracement was carried out with the formation of a flag chart pattern. A strong bullish candle broke out of the flag today. The coin is currently moving towards $0.33 price level.
XRP is on the top of the 21 periods EMAs and 50 periods EMA. The Relative Strength index period 14 is at 60 levels pointing up to connotes buy signal.


