

XRP/USD Medium-term Trend: Ranging
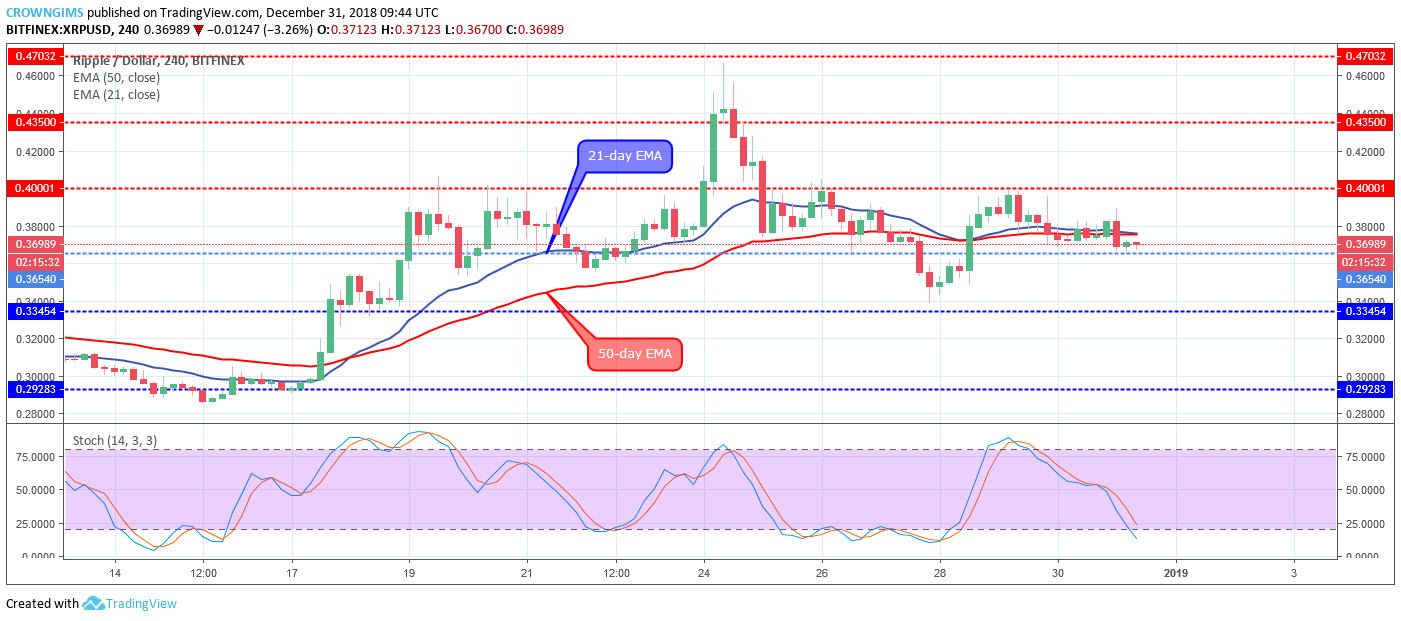
Resistance Levels: $0.40, $0.43, $ 0.47
Support Levels: $0.36, $0.33, $0.29
XRP returned to the ranging trend on the medium-term outlook after the bearish breakout. The Bears prevailed over the bulls at the consolidation that took place between December 25 and December 27. A strong massive bearish candle formed broke down the lower range of consolidation ($0.036 price level) and there was a bearish price rally towards $0.33 support level. There was a bearish price rejection at $0.33 price level and the bullish momentum pushed the XRP price back to the previous high of $0.40 after broken up the $0.36 price level, this led to consolidation again within the previous range of $0.40 and $0.36 price level.
The 21-days EMA and 50-days EMA are interlocked to each other with the price trading on the two EMAs as a sign of consolidation on the XRP market. Nevertheless, the Stochastic Oscillator period 14 is at 25 levels with signal lines pointing down connotes sell signal. The penetration of $0.36 price level by the bearish candles and its closing below the level will push the price towards the previous low of $0.33.

XRP/USD Short-term Trend: Ranging
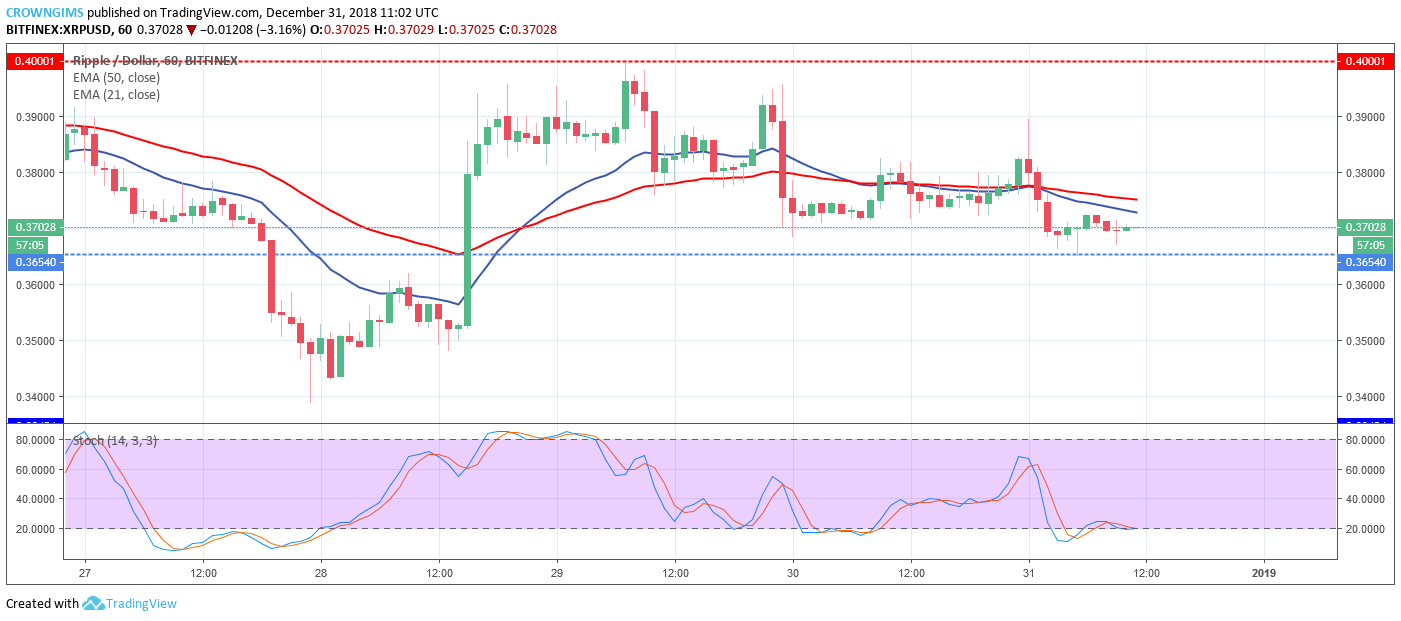
XRP/USD is on the sideways movement on the short-term outlook. The formation of “Tweezer bottoms” candle pattern shortly after the bears lost its momentum on December 28 signaled the return of the bulls into the XRP market. XRP rallied on an increased bullish momentum towards the resistance level of $0.40 after broken up the $0.36 price level. Further increase of XRP price was rejected at $0.40 by the bears and the price started a sideways movement within the range of $0.40 and $0.36 price level.
XRP is trading on and around the 21-day EMA and 50-day EMA in which the two EMAs are coiled together with partial separation and the coin below it which indicates that consolidation is ongoing. The Stochastic Oscillator period 14 is at the 20 levels with signal lines pointing down indicates sell signal.


