

Supply Zones: $21, $23, $26
Demand Zones: $19, $16, $14
BNB/USD Long-term Trend: Bearish
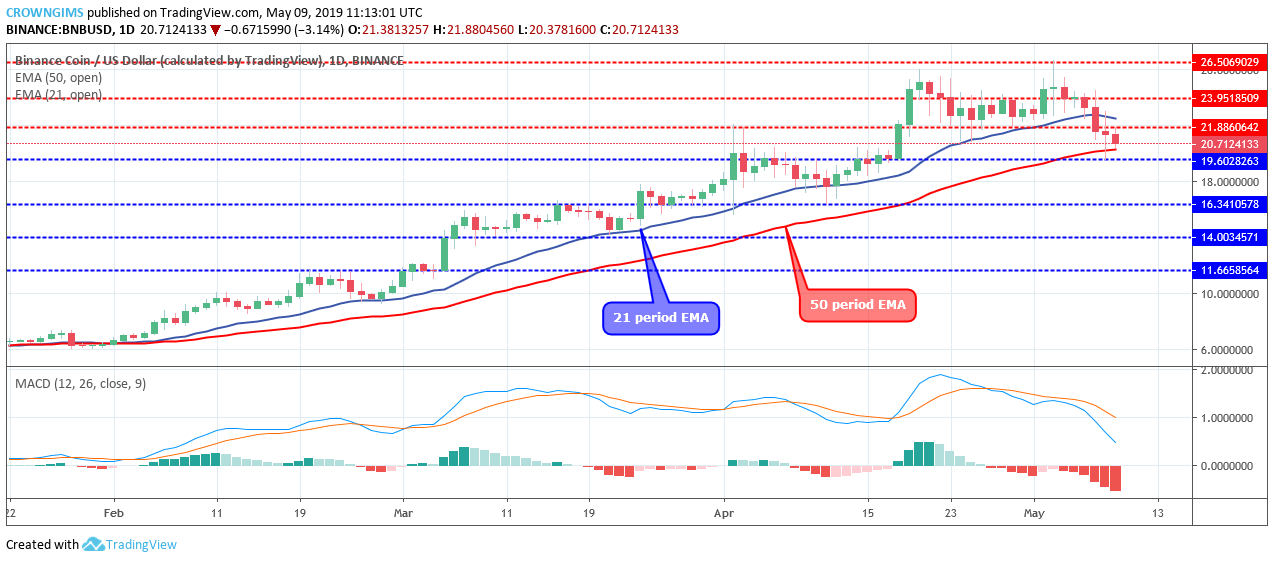
BNB/USD is bearish on the Long-term outlook. BNB has been bullish since the month of February. The Bulls topped the coin at $26 price level on April 20. The formation of an evening star candle pattern as a bearish reversal candle pushed the price down to $21 price level on April 23. BNBUSD started consolidating at $21 price level.
There was a price push up by the Bulls on May 03 towards the previous high of $26 before the Bears rejected the increase in BNB price and a Doji candle was formed. The bears later exerted pressure on the price which declines the BNB price towards $19 demand level.

At the moment, the BNB price is found in between the 21-day EMA and 50-day EMA with the formation of bearish candles which symbolize a gradual increase in bearish pressure.
Meanwhile, the Moving Average Convergence Divergence period 12 with its histogram is below zero levels with its signal lines pointing down which connotes sell signal and a further decrease in BNB price. Increase in the Bears’ momentum may lead to the breakdown of the $19 demand level which will make the BNB price heading towards $16 level.
BNB/USD Short-term Trend: Bearish
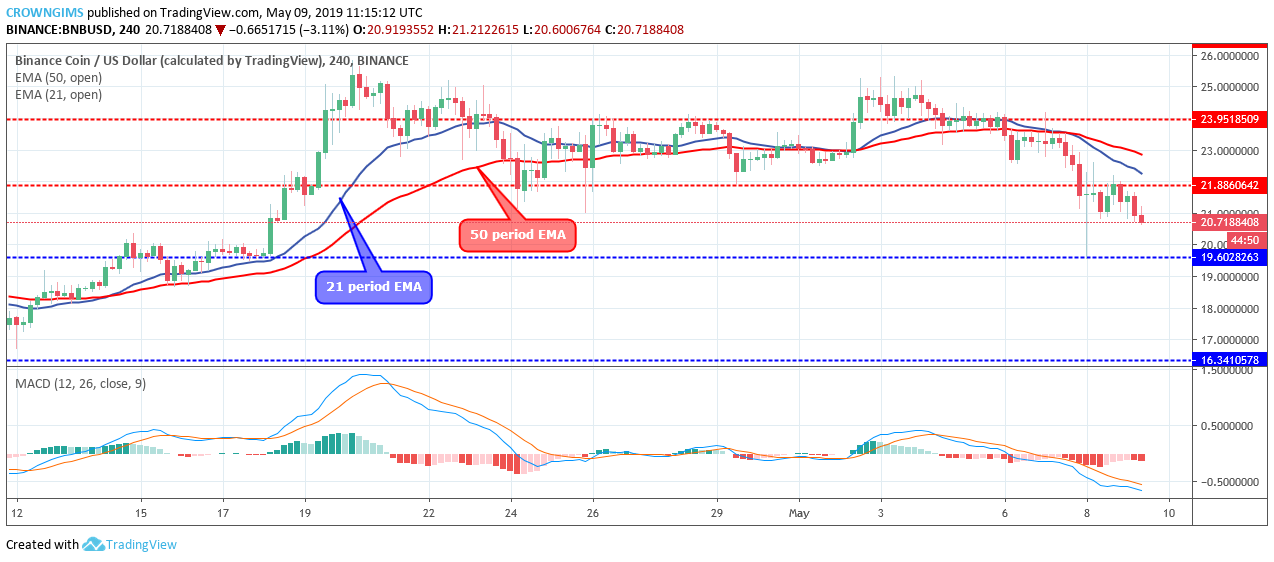
On the short-term outlook, BNB/USD is on the bearish trend. The coin was range-bound within the $21 and $23 price level, this scenario started on April 23 and ended on May 02 when the Bulls broke up the $23 level and the price increased towards $26 level.
The bears reacted against this price increase on April 4 with the formation of an inverted pin bar which is a bearish reversal candle pattern. The BNB price started falling towards the demand level of $19 after breaking the barrier at $23 and $21 price level.
The BNB price has started trading below the two EMAs and the 21 periods EMA has crossed the 50 periods EMA downside which indicate the increase in the bearish momentum in the BNB market. The MACD period 12 is below zero levels with the signal lines pointing down which indicates further declination of BNB price.
 Emerges as Top Choice for Investors, Toppling BNB and Ethereum")

