

IOTA, along with the rest of the cryptocurrency markets, has taken a beaten over the last week as prices drop by up to 25%.
MIOTA (1 million IOTA – hereby called IOTA) is currently trading at $1.27 down 37% from a price of $2.04 30 days ago.
IOTA is a cryptocurrency dedicated toward the Internet Of Things and has been dubbed as the third generation blockchain. This means that it is dedicated toward being able to be used by both machines and humans. However, IOTA is different from most currencies in the sense that it does not use a blockchain of any sort. Instead, it has been built off of a new distribution ledger technology known as Tangle.
The use of Tangle causes the removal of miners from the entire process as everyone plays an equal role within the network as they verify each other’s work forming a network of transaction verification. As a result, transactions within the Tangle network are free. Tangle can also boast about it’s fast transaction speed and its quantum resistance.
For a more in depth read on Tangle and the 3rd generation blockchain, take a look into our previous article here written by Joseph Kamande.
Let us take a look at price action over the long term.
Price Analysis
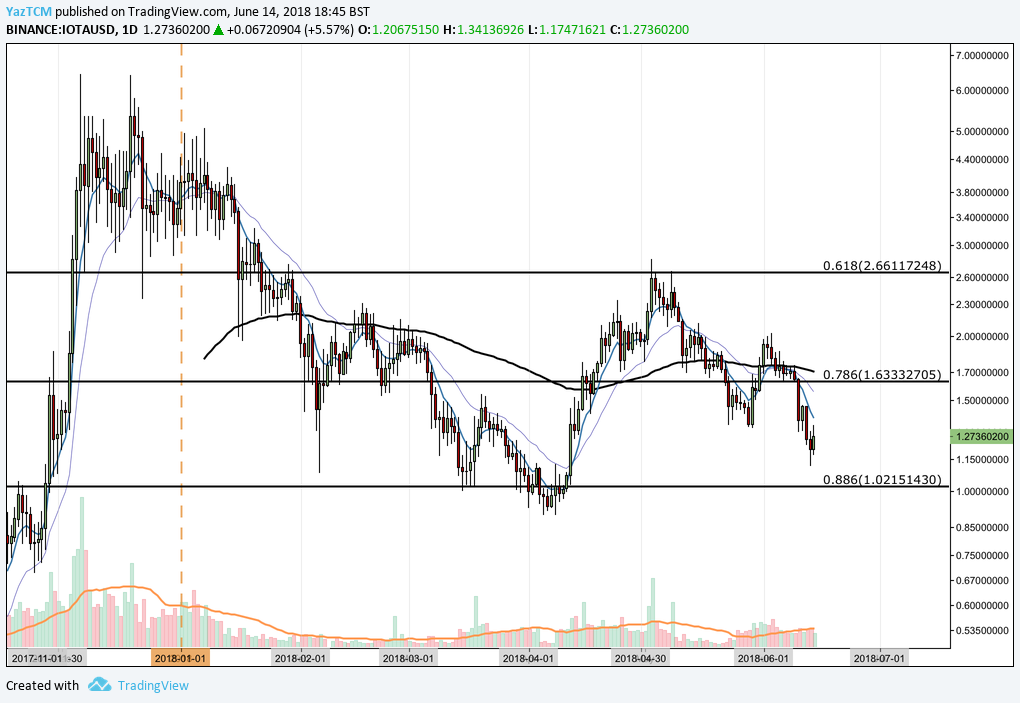
IOTA/USD – LONG TERM – DAILY CHARTS
https://www.tradingview.com/x/dVeqdMM8/
Over the long term we can see that IOTA has been suffering during 2018 against the USD. IOTA started the year trading at a price of $3.53 and has since deteriorated to a current price of $1.27.
We can see that during the months of November and December last year, IOTA went on an incredible bullish run as price rose from a low of $0.32 to a high of $6.40, an absolutely incredible run of close to a 1800% increase. However, as the new year started, the bulls ran out of steam.
Price action had retraced to the .886 Fibonacci retracement at a price of $1.02 in April before rebounding. This is a Fibonacci retracement taken from the incredible bullish run seen in the final two months of the previous year.
For the majority of the year, IOTA has been trading within a wide range marked by the .618 Fibonacci retracement at $2.66 and the .886 Fibonacci retracement marked by $1.02.
For the market to be considered a long term bullish market, we would need to see a break above $2.66. For the market to be considered a long term bearish market, we would need to see price break below the $1.02 handle.
We can see price action has been having an extremely tough time recently as price falls rapidly beyond the low that was seen in May. Price action is currently approaching the .886 Fibonacci retracement at $1.02 where we expect the market to gain some form of support.
Let us take a look at price action over the short term.
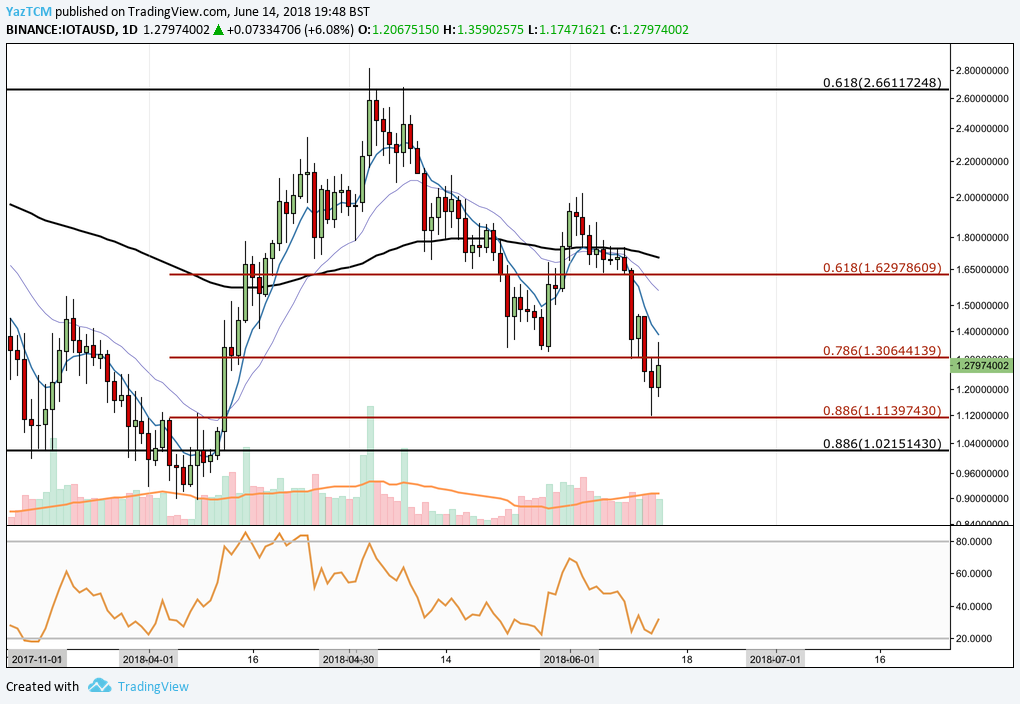
IOTA/USD – SHORT TERM – DAILY CHART
https://www.tradingview.com/x/aqWef97s/
Looking at the charts from a closer time frame, we can see that IOTA had experienced a bullish month during April when price action rose from a low of $0.89 to a high of $2.81 experienced in early May, equating to over a 200% increase in price.
Price action has since fallen and found some favourable support at the short term .886 Fibonacci retracement, marked in red, at a price of $1.11. If price action can hold above this level then we may see the bulls find momentum and push prices back toward the highs of $2 seen toward the start of June. If IOTA can eventually break above $2 then it is free to go on to test the long term range boundary at $2.66. However, the bulls will need significant momentum to achieve this.
Alternatively, if bears began to gather steam once again and push prices below $1.11 then we may see prices head lower toward $1.02. The lowest support for IOTA beyond here lies at $0.89 which is the low seen in April.
The technical indicators are currently showing signs that largely favour the bulls. The RSI is well below the 50 level and is trading around the 30 region. A small token of hope for the bulls may come from the fact that RSI has battled its way to the 30 handle from extreme oversold conditions around 20, which could indicate that bearish momentum is fading.


