2019 has breathed optimism to cryptocurrency investors following a bearish 2018. Over the last few weeks, the Bulls took over the markets, which saw attempts at market correction. The Bears saw a protracted dip in prices of most Altcoins, the magnitude of which was felt across the board.
Previous price zones were tested and breached. Bitcoin, for instance, slumped from the $6500 mark to $3000. This was the largest drop since 2013 when the Bears had engulfed the markets. The markets are looking promising, however, as the Bulls have put up an upward rally for most coins In the top twenty brackets.
BTC/USD

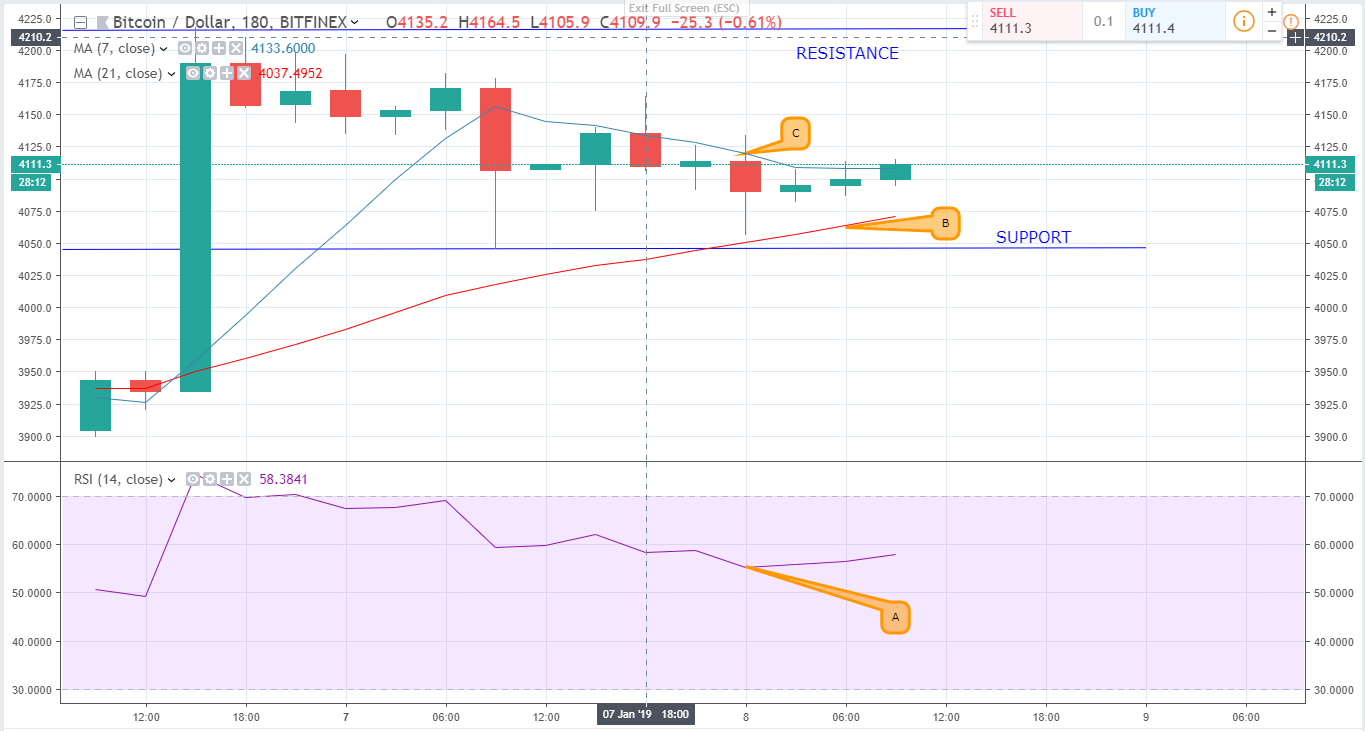
Bitcoin is up by 1.11% over the last 24 hours after an upward rally pushed prices to the $4000 mark. At the moment, Bitcoin is selling at $4075 with the 7 days Moving average (marked C) dominantly above the 21-day moving average (marked B). This signals an upward rally in the short term.
Since BTC went below the $4000 mark, there have been numerous attempts at market correction. Market activity has supported those efforts as was seen in the last few days. The Relative Strength Index (marked A) – (RSI) drifted into the ‘undersold area’ (above 70) severally signaling positive investor sentiments.
Both the 21 days and the 7 days EMA is currently upwards, which indicates that the Bull Run might be here for long.
ADA/USD

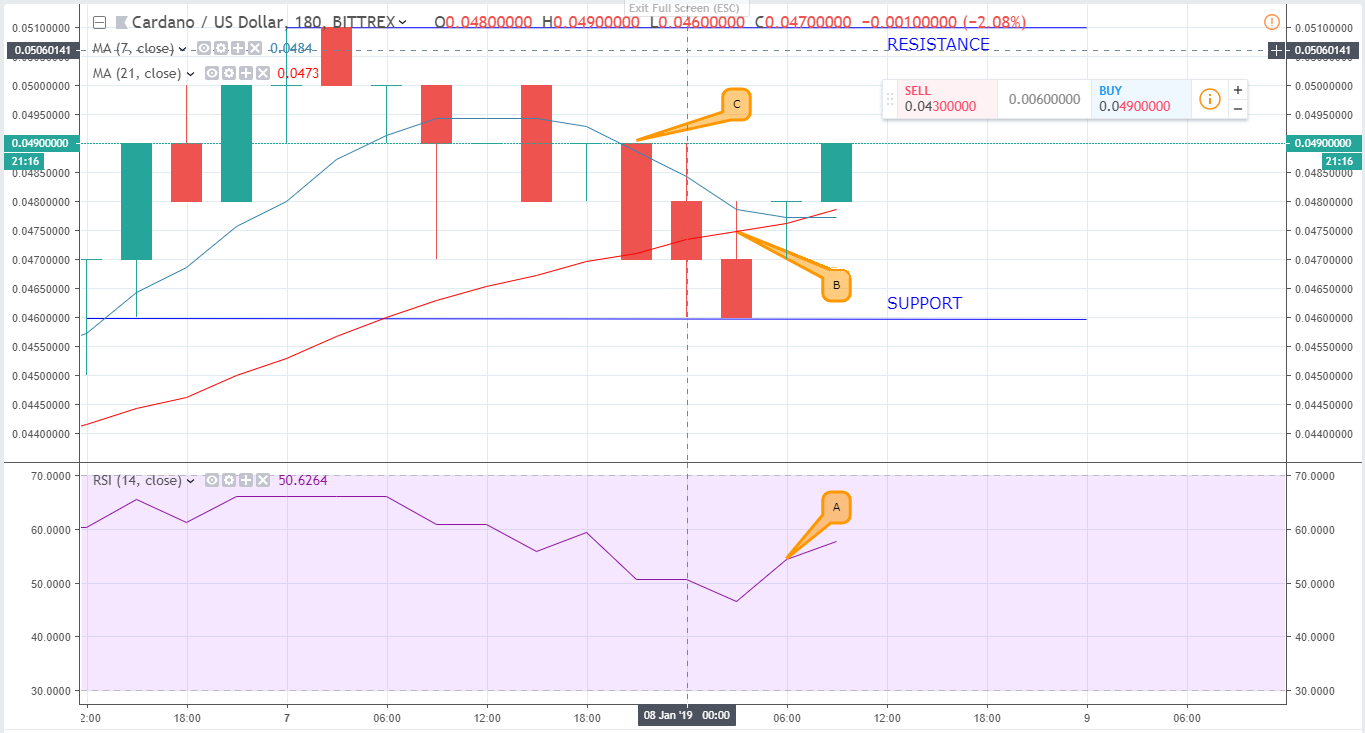
Like Bitcoin, Cardano (ADA) has been going through a market correction after a tumultuous fourth quarter of 2018. ADA is up by 1.32% over the last 24 hours with the Bullish momentum looking to continue in the short term.
The 21-day moving average (B) is currently acting as price support at the $0.49 mark. This indicates an upward rally that may push prices above the psychological price zone of $0.5.
In terms of market activity, Cardano sold $32 Million and is currently at $1.2 Billion in market capitalization and the RSI (marked A) is at 60 near the undersold area (70) which shows little willingness by investors to dispose of their holdings.
IOTA/USD

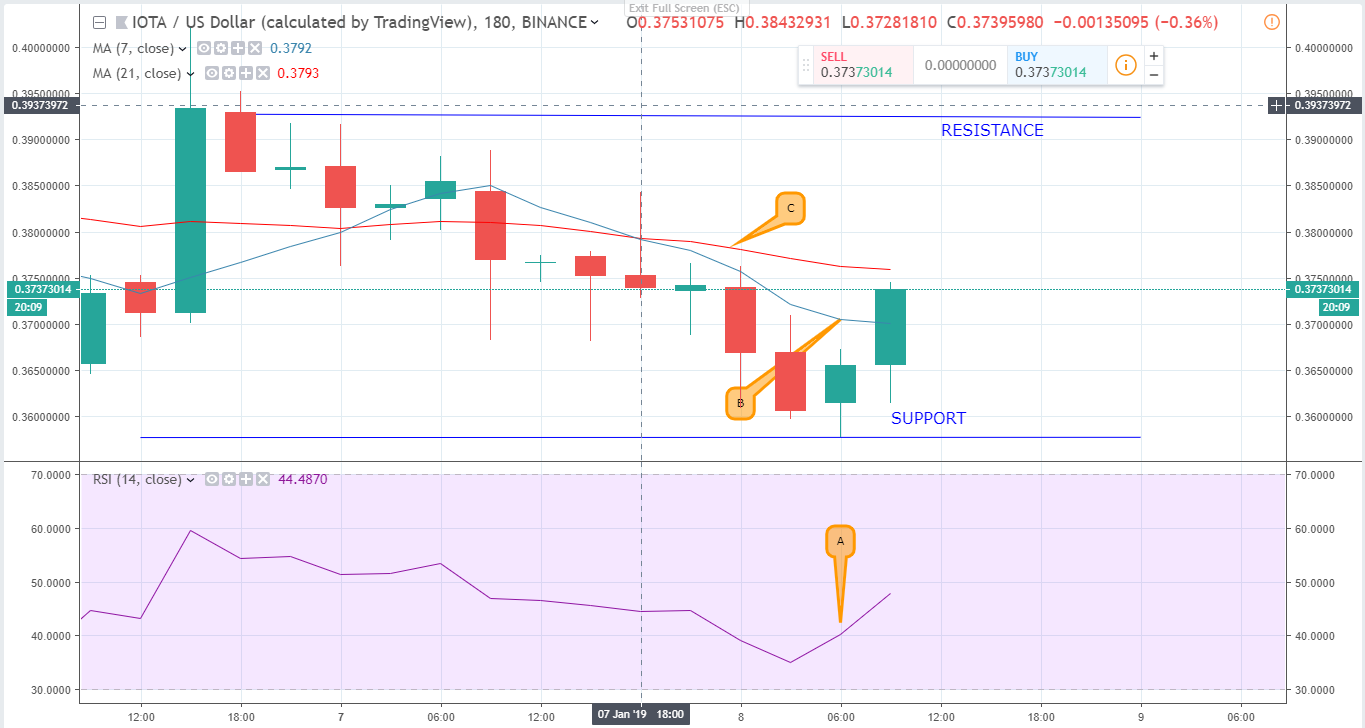
Unlike BTC and ADA which saw upward rallies over the last 24 hours, IOTA suffered a slow dip. It began off selling at $0.3870 against the current rate of $0.3788 at which it is exchanging against the dollar. This represents a 4.62% loss in its value.
The bearish trend was also experienced in the RSI (Marked A). It hit a low point of 37 threatening to cross into the ‘oversold’ area. This represents slumped investor sentiments. Also, the 21 days EMA (C) has been dominantly above the 7 days EMA (B) and is currently acting like the price support.
Unless the Bulls can up their momentum, the bearish trend might be here for long.


