XRP/USD

The day began with a bearish price momentum which pushed the price to a low of $0.2947 at (A). Later on, the 7-day MA crossed over the 21 day MA at (Z) indicating a bullish signal. Investors pulled the price back up to a high of $0.2983.
Resistance level (R) is seen at $0.2982 and support level(S) at $0.2960. Around the support and resistance zone, the indecision of the market was encountered but later on, the RSI was seen between 40 and 60 confirming luck of momentum in the market.
Later on, traders pushed the price up to a high of $0.2959 at (B). A bearish engulfing pattern followed that led to a decrease in price. Currently, XRP is trading at $0.2964.
FORECAST
During the last hour, the 21-day MA seems to be crossing over the 7 day MA indicating a bearish signal. The RSI is heading south this also indicate a downtrend in the next few hours. We expect the bears to pull the price further down with the next target being $0.2952.
XLM/USD

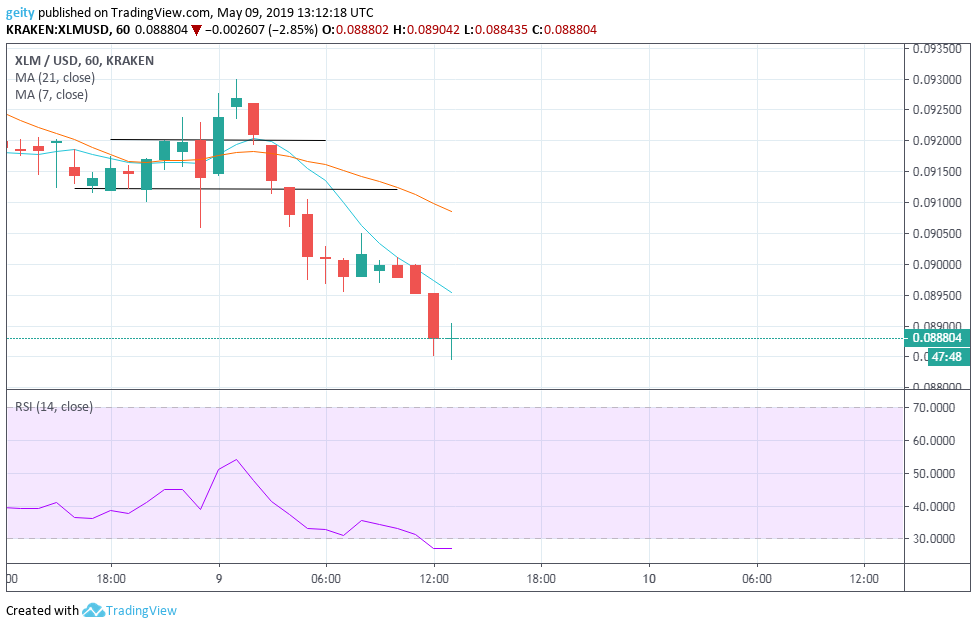
The day began with a sideways trend indicating a lack of momentum in the market. The moving averages were also intertwining thus confirming a ranging a market.
Later on, sellers manage to push the price slightly up, to achieve a high of $0.0920 and support level at $0.0912. Prices later breached support levels to close at $0.08879. XLM began trading at $0.0918 and is currently trading at $0.0891.
FORECAST
The RSI is seen below 30 around 12:00 this indicates an oversold market. We expect the prices to move further south with resistance levels at 0.8950
ADA/USD

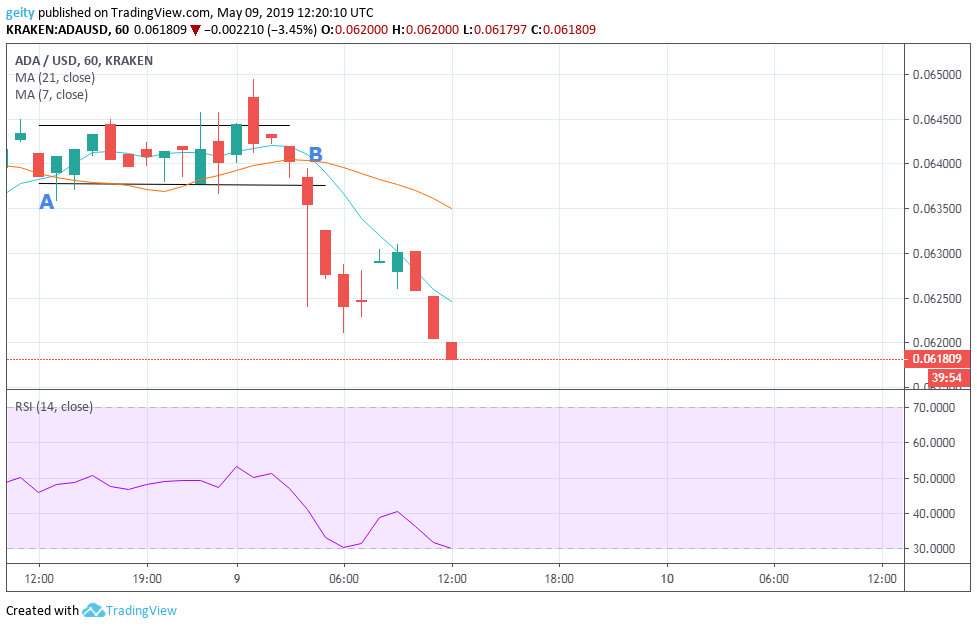
The day started with a sideways trend (A). Later on, at around 05:00 (B) the 21-day MA crossed over the 7 day MA indicating a bearish signal, this resulted into a downtrend where prices dropped to $0.06179. The market is currently trading at $0.0605.
FORECAST
The RSI is seen around 30 reflecting an imminent bearish rally. Moving forward, we expect the price to dip further with resistance levels at $0.06.


