Cardano is currently trading at $0.11 after a massive price spike today from a low of $0.101. The digital asset is outperforming the entire market, climbing above several key indicators and hinting at a long-term reversal.
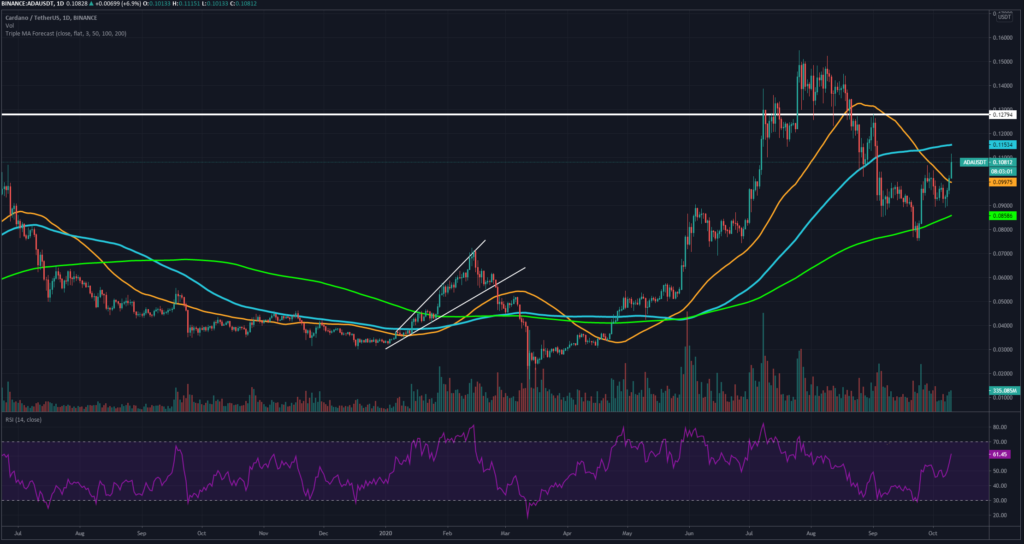
On the daily chart, ADA has surpassed the 50-SMA, turning it into a support level and it’s eying $0.115, where the 100-SMA currently stands.
Furthermore, the bulls managed to establish a higher low at $0.089 compared to $0.075 and a higher high, confirming a daily uptrend.

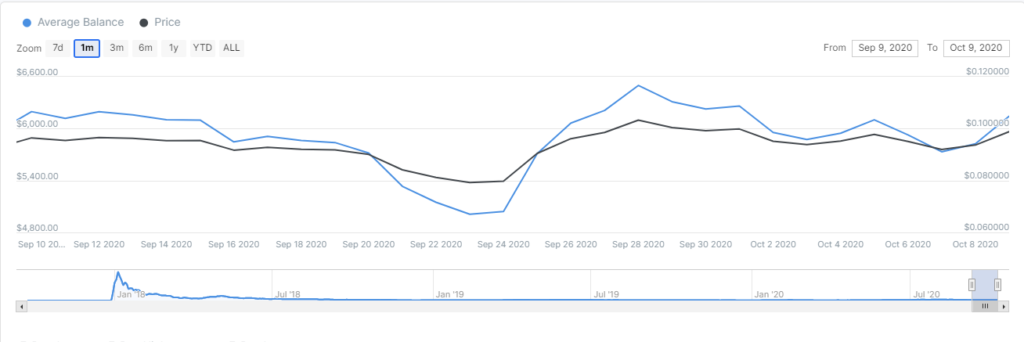
If we look at the average balance of ADA holders, we can observe a significant spike on September 3 from $5,000 up to $6,498, and still currently at $6,143. This metric indicates that more investors are willing to hold larger sums of ADA.
What’s the next target for ADA bulls

As we stated above, the next price target would be $0.115 where the 100-SMA sits, however, this is only a short-term price point. The next most important resistance level was established at $0.128, the high of September 1.
The 50-SMA will act as a strong support level if there is a rejection at $0.115. The RSI is not yet overextended on the daily chart but it’s getting dangerously close. In the longer-term, the 2020-high at $0.154 is a realistic price target.
The Long-term is in favor of the bulls

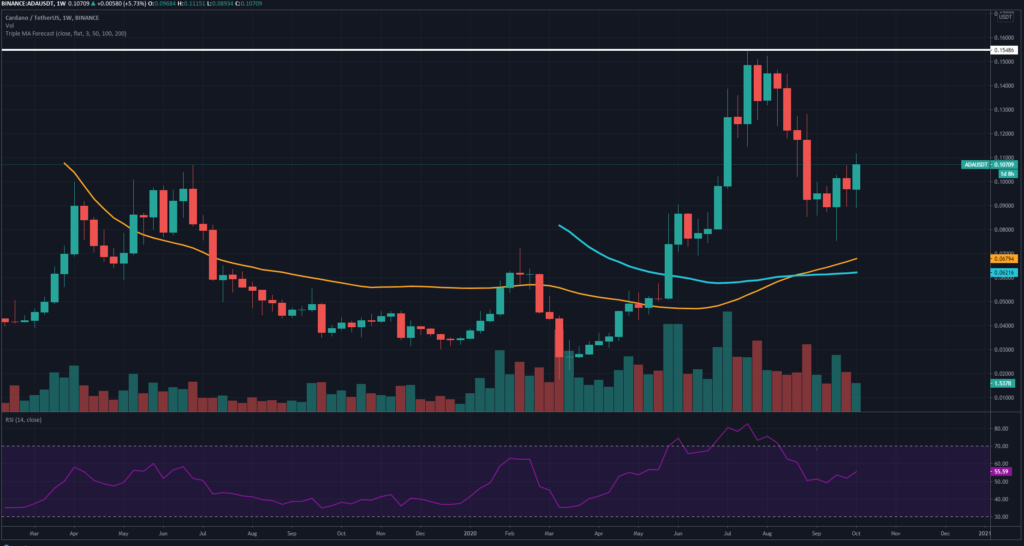
On the weekly chart, the price of ADA established a clear higher low at $0.075. The uptrend is intact and both the 50-SMA and the 100-SMA are all the way down $0.067 and $0.062. The RSI was overextended from May through August and has now cooled off significantly.
The trading volume has been declining, which indicates the pullback was pretty weak. Bulls would love to see it growing. Cardano is currently ranked 9th by market capitalization and has the potential to surpass even BNB at $4.1 billion.


