ADA/USD Price Medium-term Trend: Ranging

Supply Zones: $0.078, $0.082, $0.088
Demand Zones: $0.073, $0.069, $0.054
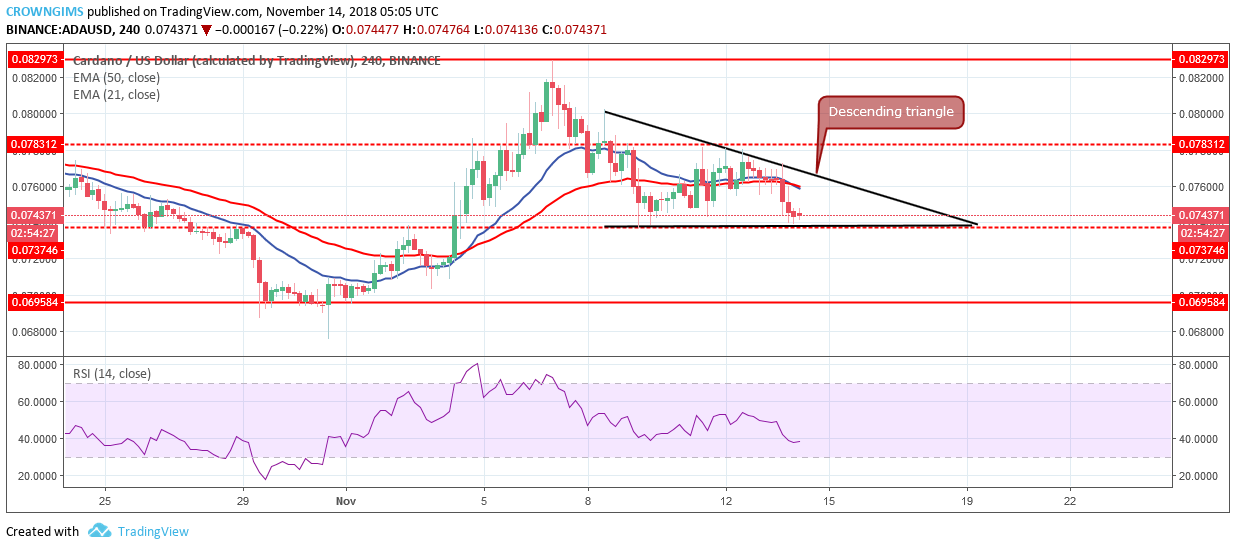
ADA is ranging on the 4-Hour chart. The cryptocurrency reached the high price of $0.082 last week, the bulls lost the pressure and could not push the ADA price to break the supply zone of $0.082. the bears took over the market with the formation of Doji candle at the supply zone followed by bearish candles as a confirmation of bears’ pressure.
Further increase of the bears’ pressure broke the last week demand zone of $0.078 downside that led to consolidation. The price has formed a “Descending Triangle “ pattern within the 4-Hour chart.
The 21-day EMA and the 50-day EMA are closely interlocked as a confirmation of the ranging market up. ADA price is trading below the 21-day EMA and the 50-day EMA which indicate the bears’ pressure.
In case the bears gain enough momentum, the coin will break out of the lower trend line (support level of $0.073) of the triangle, and it will expose the demand level of $0.06. At the same time, should the bulls defend demand zone of $0.073 and break out the upper trend line of the triangle then ADA price will experience an increase that may break the supply level of $0.078 and expose the $0.082 price level. As a recommendation, traders should wait for breaking out before placing a trade.
ADA/USD Short-term Trend: Ranging

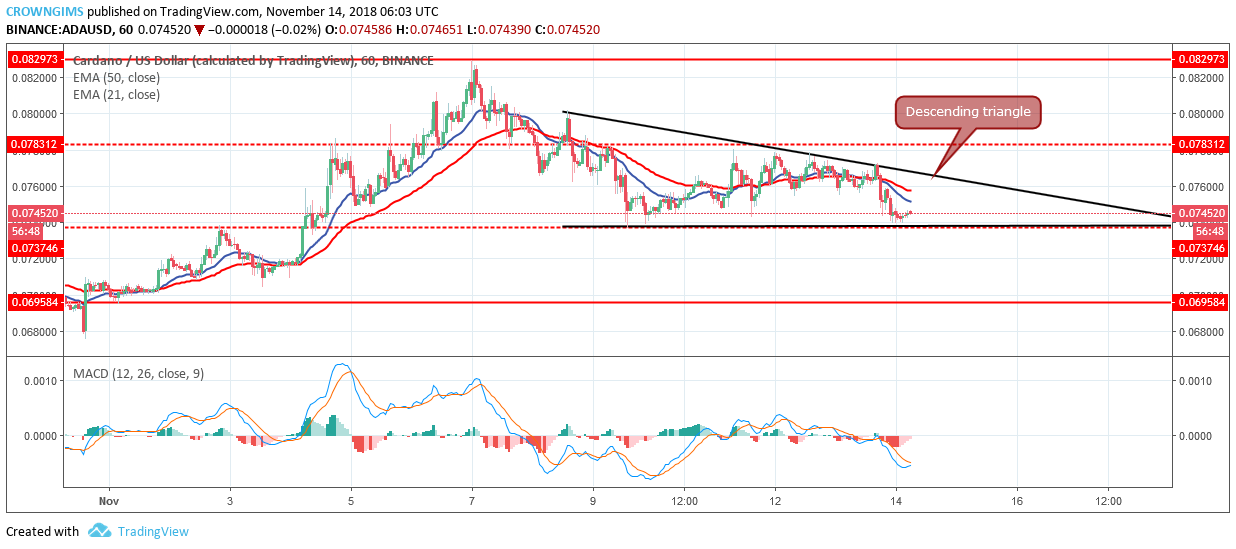
The cryptocurrency is also ranging on the short-term outlook. The formation of the descending triangle pattern is an evidence of consolidation in the ADA market. It is high momentum from the bulls or bears that will bring the ADA price from the triangle and make the market to trend.
The price is below the 21-day EMA and 50-day EMA with the MACD below the zero level which connotes the bears’ pressure.


