
 and Stellar (XLM) Weekly Price Performance Analysis")
Cardano (ADA/USD)
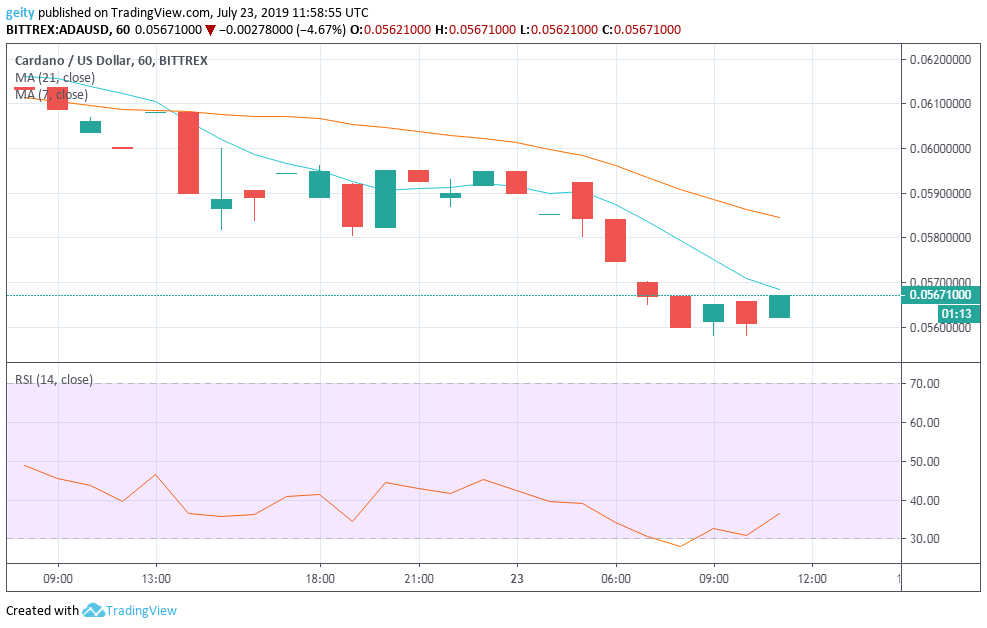
On an hourly chart, ADA/USD continued to display a further downward pressure. The bearish rally was supported by the 21 day MA that was seen trading above the 7 day MA. The RSI indicator dipped from a high of 49 to a low of 27 that showed an increase in bearish pressure. Notably, the bears had the upper hand over the last 24hrs.
The market saw a short-term price fall that later consolidated below the key support level $0.05823. Presence of a four-price Doji was seen severally that signaled lower transaction rate. This was followed by a further price fall that fluctuated the price down to a low of $0.05600.
At around 08:00, ADA hit the oversold level followed by a reversal. The pair’s price seemed to have gained momentum since the RSI indicator recorded an upward rally during the last 3hrs. It has moved up from 27 to 37 that showed investors anticipating the coin to surge.
Forecast
At the moment, the RSI is heading north that signals incoming Bull Run. The coin is likely to consolidate before a breakout. New targets should be set at $0.05800.

EOS/USD
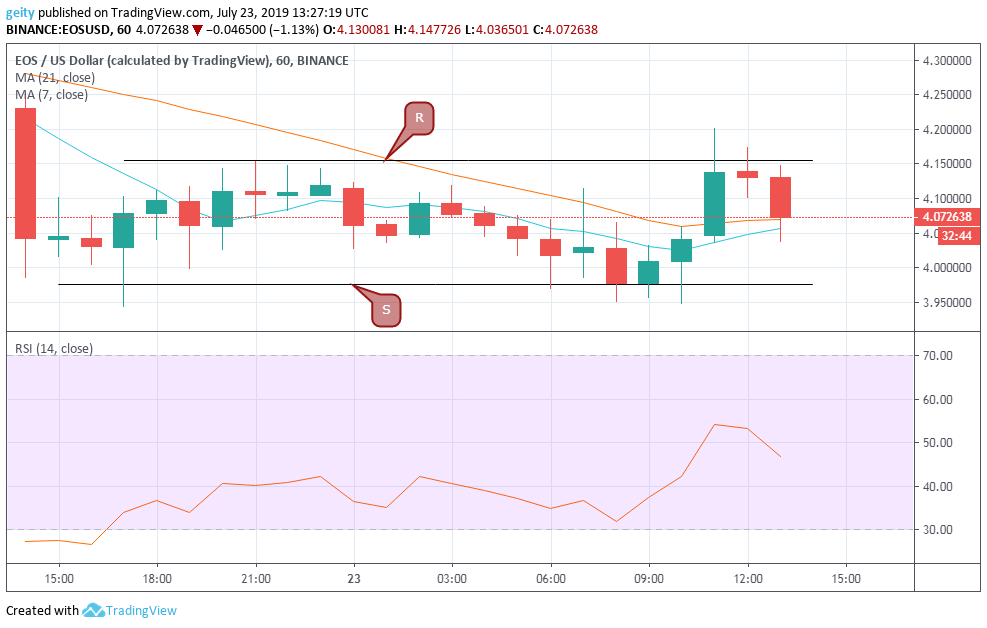
Unlike ADA, EOS/USD pair has slightly gained by 0.73%. EOS began trading at $4.04 and is currently trading at $4.16. Despite an overall bearish rally that was buttressed by the 21 day MA that traded above the 7 day MA. The RSI recorded otherwise since it was seen moving upwards from a low of 26 to a high of 54 that showed an increase in buyouts.
The downward momentum defined resistance level at $4.15 and support level at $3.97. The RSI indicator is currently heading south, showing reduce confidence in the coin by investors, thus increase sellouts.
Forecast
At the moment, the 21 day MA is above the 7 day MA, and the RSI indicator is heading south. All the indicators point towards a bearish market rally in the next few hours. New targets should be on $3.90.
Ripple (XRP/USD)
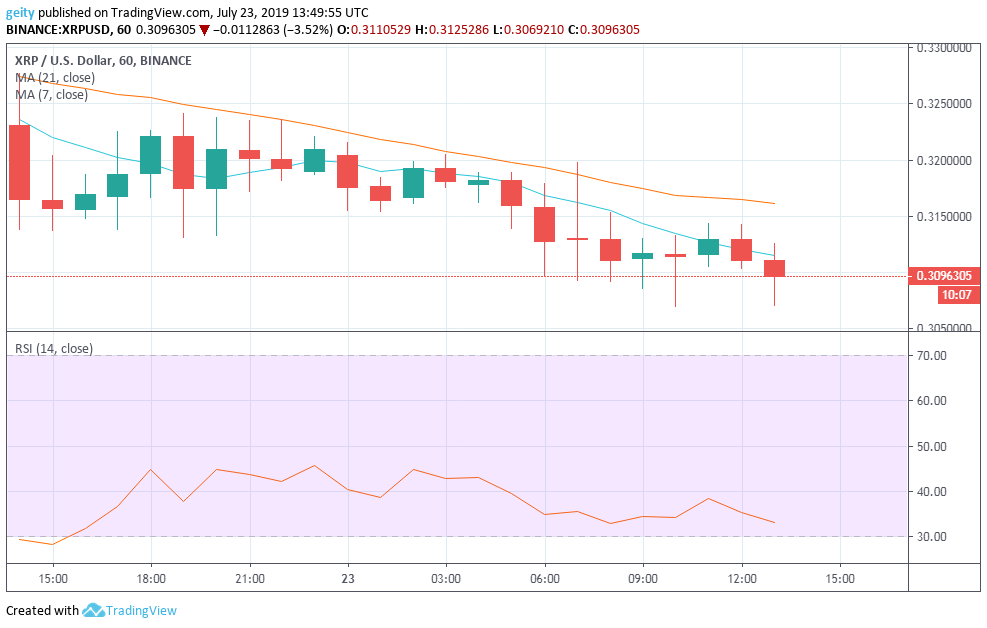
XRP/USD, on the other hand, recorded a bearish outlook over the last 24hrs. The 21 day MA gravitated above the 7 day MA which supported the downtrend. XRP has an intraday dip of 2.1%, having begun trading from a high price of $0.3164 and has currently lowered down sharply to trade at $0.3096.
The RSI indicator was also seen trading below level 50 throughout the 24hrs period. This showed an increase in selling pressure. The RSI indicator is currently heading south that indicates reduce coin confidence by investors. Nevertheless, the dip in the pair’s price has negatively affected investor’s sentiment.
Forecast
At the press time, all indicators signal further bearish rally, the 21 day MA is still above the 7 day MA and the RSI is heading south that indicates downward pressure. New targets should be set at $0.28.


