Summary
The last few hours has seen BTC break temporary resistance levels defined in $5,160 to achieve a high of $5,215. XLM has also breached its range bound market to the upwards and achieved a new high of $0.120. XRP seems to be on a sideways trading market with indicators seemingly portraying a market that is bound to head south in the short term with support levels expected to be at $0.32699.
BTCUSD

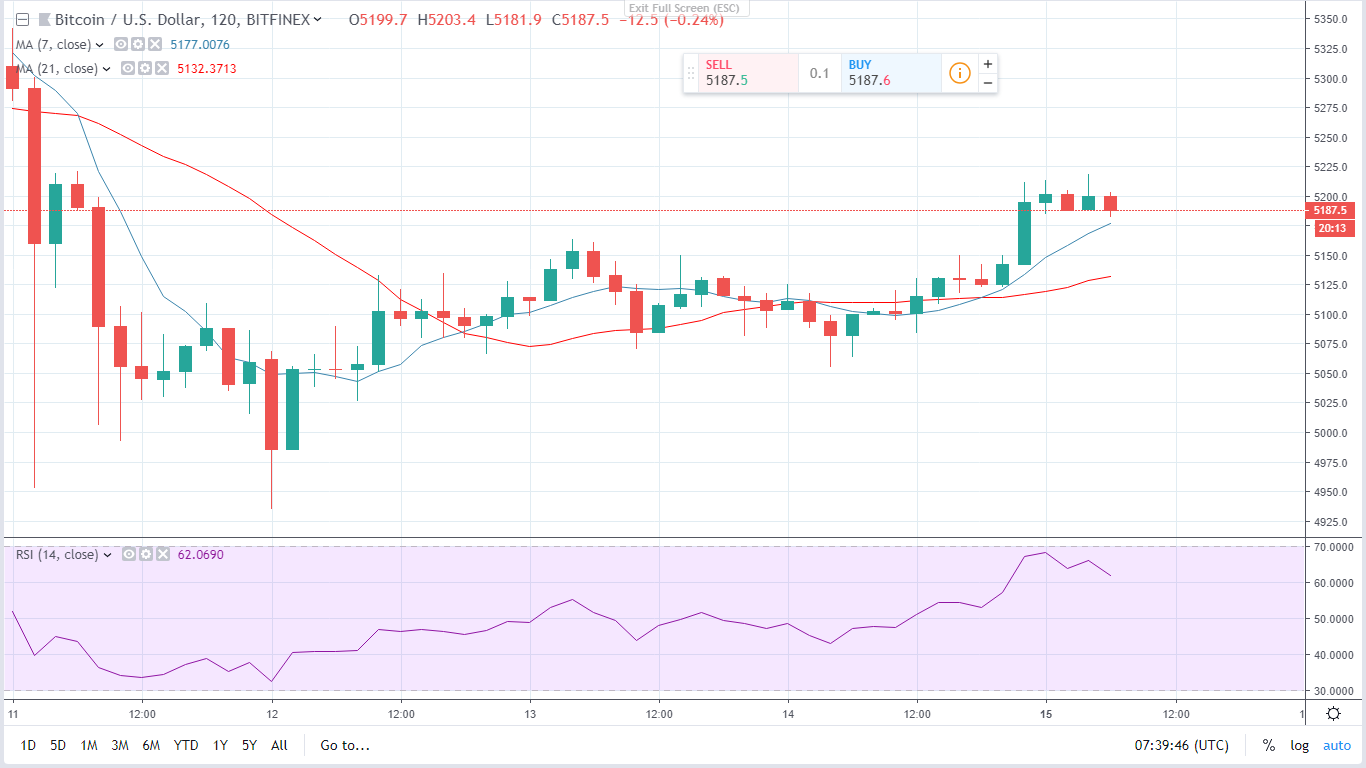
The last 24hours has seen the price of BTC breach a sideways trading market to the upwards by breaking temporary resistance levels that had been defined at $5,160 to achieve a new high of $5,218. The market had been on a range bound movement within the last 24 hours finding resistance at $5,160 and support at $5,080. The 7 day and 21 day MAs were also intertwined during this period (2-hour charts) seemingly portraying market that was on consolidation.
Looking at the RSI during this period, the levels were at the range of 40 and 60 seemingly signifying that the rally had lost its strength. However, on the 15th the 7 day MA crossed over the 21 day MA as a signal that we should expect the rally to continue. This was followed by the price rising past the previously defined résistance levels and setting a new high of over 5200 at least in the short term.
BTC Forecast
The 21 day MA has moved past the 7 day MA setting stage for a bullish outlook. We expect that it will act as support for the upward trend. Support levels in the short term can be placed at $5,160. If the prices bounce back from this, traders can take a long position with new résistance levels defined at $5,225, at least, in the short term.
XLMUSD

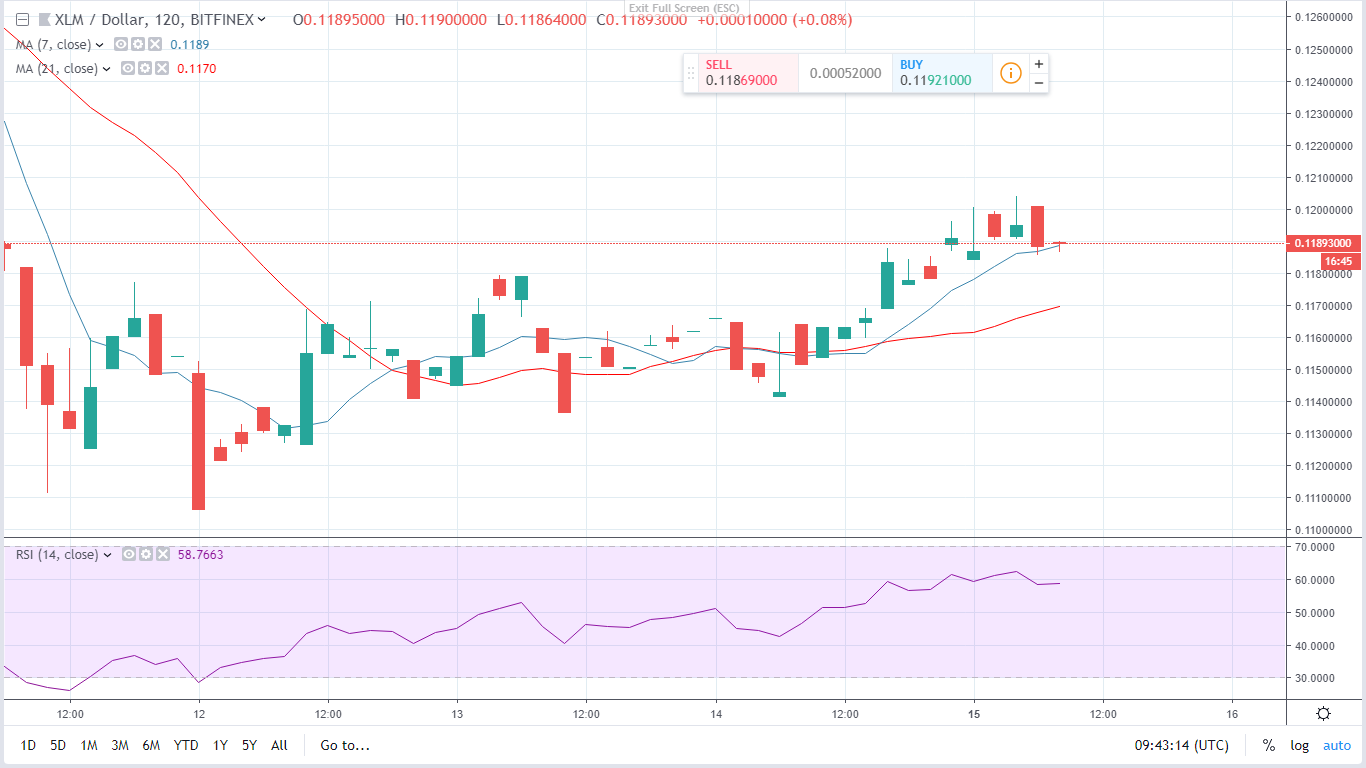
The last 24 hours have seen XLM break its range bound market and achieve a short term high of $0.120. After the recent crypto rally, there was a death cross formation that brought the price of XLM into a range-bound market that had its resistance levels defined at $0.118 and support levels defined at $0.114. The RSI was also hovering within the 40 and 60 levels seemingly indicating that the market had lost its momentum as it prepares for the next move.
However, at the dawn of 15th, the market was characterized by a golden cross candlestick formation that saw XLM rise past its short term resistance levels to achieve a high of 0.120.
XLM Forecast
We expect that in the short term, new support levels will be defined at 0.118.The 7 day MA has created a wide margin against the 21 day MA so we expect a further rally in price from this current levels. Traders can take a long position if the price bounces back from the support levels.
XRPUSD

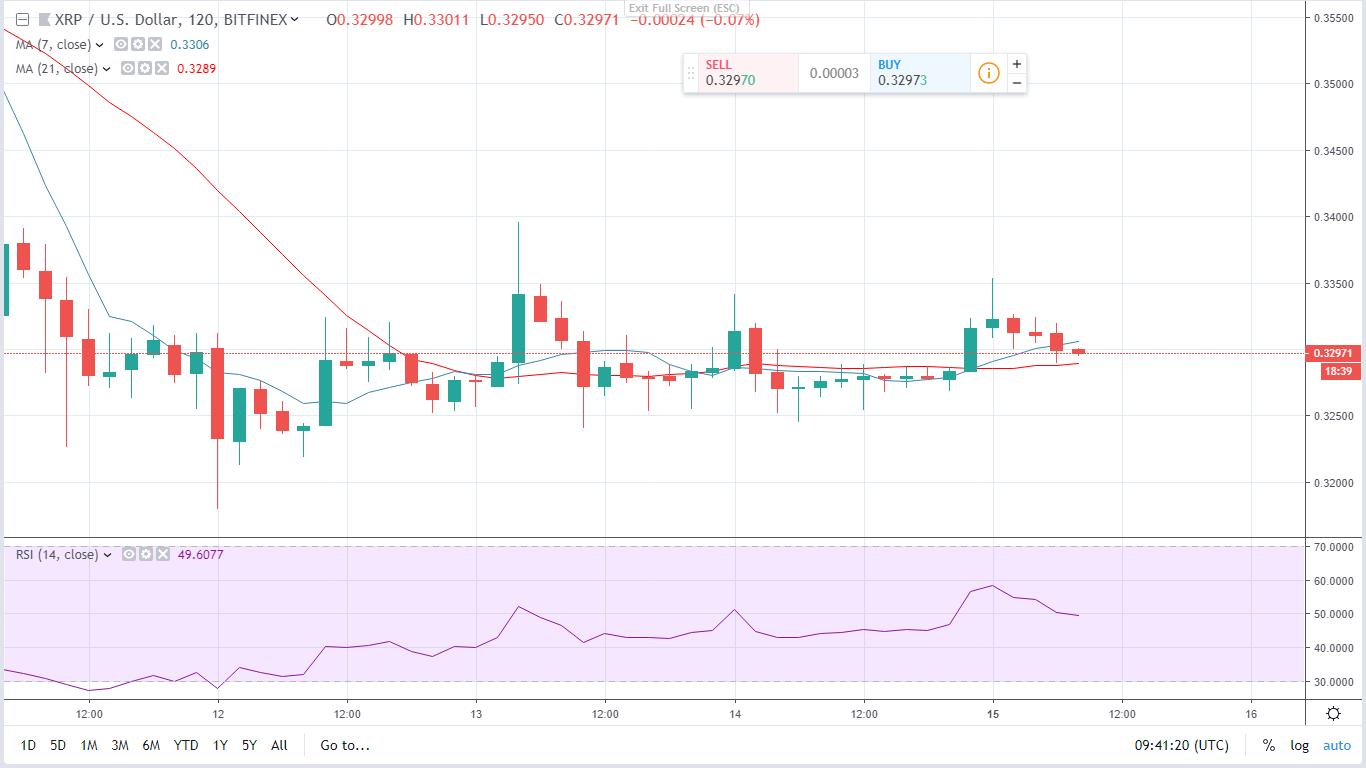
XRP has been on a range bound movement in the last few hours. A bearish engulfing on the 14th brought the price down to a low of $0.2451. The bulls then briefly managed to push the price up to and found support at $0.32719. Resistance levels in the last few hours were placed at $0.32870. However, these temporary resistance levels were breached and a bullish engulfing pushed the price up to a high of $0.3353.
XRP Forecast
Currently, the RSI is within the levels of 40 and 60 seemingly indicating that there is a lack of momentum as we wait for the next price movement. Three black crows candlestick formation may indicate that a dip in price may be imminent. Traders can take a short position as the price is expected to fall. However, support levels for this price movement can be placed at $0.32699.


