

Bitcoin’s recent price movements have presented a mix of positive indications and challenges, resulting in a cautious sense of optimism among investors regarding its future.
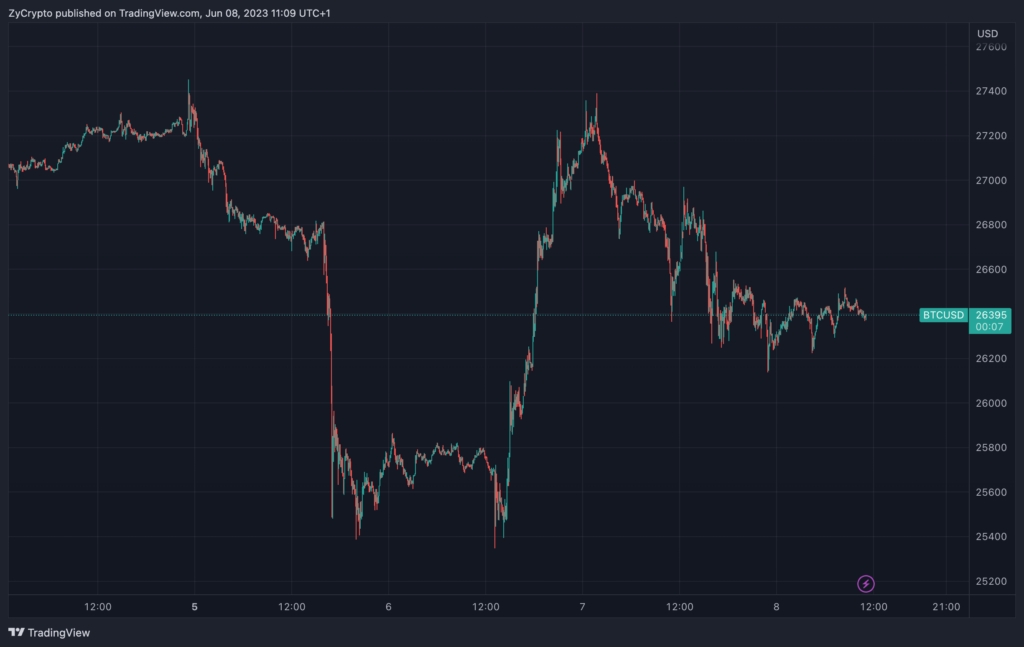
Throughout the previous week, Bitcoin had comfortably sustained a position above $27,000. However, the allegations against Binance and Coinbase have reignited concerns about the industry’s integrity and raised questions about regulators’ intentions to tighten their control over the crypto sector.
The top cryptocurrency experienced a flash crash on Monday, plummeting to around $25,500 in response to the Securities and Exchange Commission’s (SEC) lawsuit against Binance for allegedly violating securities laws. However, Bitcoin showcased its resilience by swiftly rebounding, and on Tuesday, it surged to a price of $27,390, with traders seemingly disregarding SEC’s move.
Earlier today, on-chain analytics firm Glassnode shed light on the market’s reaction to the mounting regulatory pressures. Notably, despite significant volatility triggered by the intensifying regulatory scrutiny from US authorities, Glassnode revealed that the recorded realized losses on-chain remained relatively low at $112 million.
“This remains -$3.05B (-96.5%) smaller than the largest recorded capitulation event, suggesting an increased degree of resilience amongst market participants,” tweeted the firm.

Cryptohell, an analyst from Cryptoquant, highlighted impressive long-term holder reactions amidst the negative news surrounding Binance. In a tweet, the analyst examined two indicators, Exchange Inflow – Spent Output Age Bands and Exchange Inflow – Spent Output Value Bands, to identify the investors responsible for the short-term correction in Bitcoin’s price.
As per his analysis, long-term holders with a holding period of over one year did not engage in significant sell-offs. Instead, holders with 3-6 months holding periods, day traders, and weekly swing traders were identified as the current sellers.
The pundit concluded that long-term holders continue to retain their Bitcoin supply, leading to speculation that they may be preparing for the anticipated halving event in 2024.
That said, despite Tuesday’s resurgence, Bitcoin’s woes seem to have worsened, with the SEC reportedly asking a court to freeze the assets of Binance US temporarily. This led to Bitcoin witnessing a further drop Wednesday, with crypto analyst “Material Indicators” tweeting, “Yesterday went as predicted. Today, FUD continues to stimulate PA across the market.”
The pundit then shared his analysis, stating that Bitcoin is currently retesting the 200-Week Moving Average (MA). However, bid liquidity appears to be relatively low at this level. According to him, should the 200-Week MA fail to hold, he predicted another retest of the 50-Month MA, where both liquidity and sentiment exhibit greater strength.
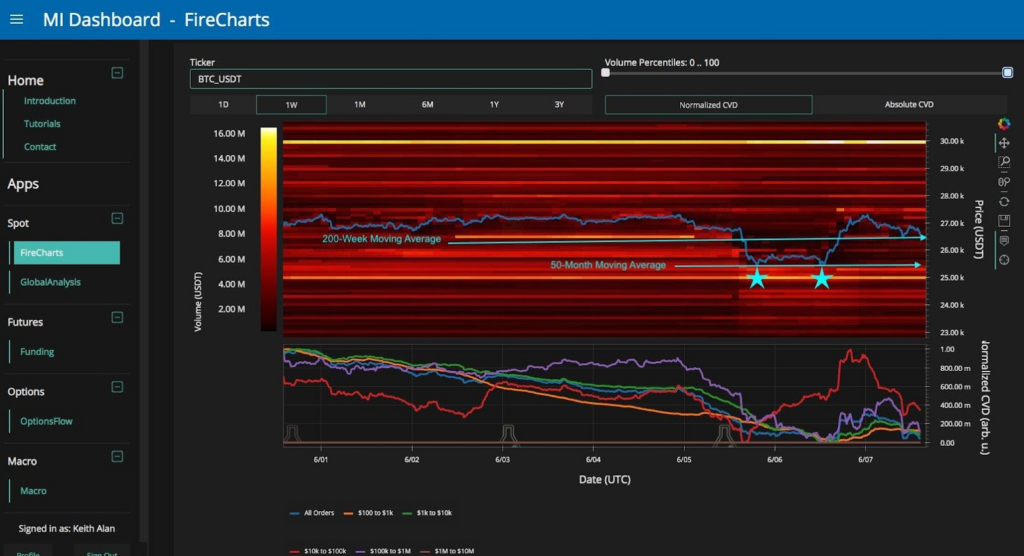
Notably, Bitcoin has already formed a double bottom pattern at the 50-Month MA, which is visible in the hourly timeframes. If a triple bottom were to emerge, it would signal a bullish trend, according to Material Indicators.
However, the expert cautioned that a sudden price drop to $25,000 could potentially clear the path towards a bearish market sentiment, urging traders to “plan for the possibilities.”
At press time, Bitcoin was trading at $26,384, down 0.27% in the past 24 hours, according to CoinMarketCap data.


