
")
Bitcoin continued to trade sideways on Sunday, dragging on in a tight price squeeze for nearly three weeks. So far, the top cryptocurrency by market capitalization hasn’t seen a repeat of the excitement witnessed in January and added roughly 0.15% in the past week, according to data from CoinMarketCap.
As Bitcoin continues to seesaw, observers have been trying to understand what the current phase could mean for the pioneer crypto asset, with a majority convinced that a gargantuan bull market is in the offing.
According to popular market analyst “Ali” Bitcoin seems ready to pull a bull run just like the one in April 2019, with the New Unrealized Profit or Loss (NUPL) mirroring the said rally.
“When looking at the NUPL, it appears that BTC is consolidating like it did in Apr’19…In Dec’18 Bitcoin hit a low of ~$3K before it rose 75% in the following months to hit ~$5.5K in Apr’19. BTC then consolidated for 4 weeks before rising 150% to peak at ~$14K in June’19,” Ali Tweeted.

Another crypto analyst, “Trader Jibon”, noted that Bitcoin’s daily golden cross- popularly known as the “death cross”- had been confirmed, mirroring the 2015 and 2019 pre-bull run scenarios. The golden cross is a key technical indicator used to gauge momentum and occurs when the 50-day simple moving average crosses above the 200-day simple moving average.

“If you look at the history, you can understand that if it goes up after the golden cross, then the highs go up, if it goes down, then there is a big crash. All will be cleared in a few days,” wrote Jibon.

In its latest “Week On-Chain Newsletter”, onchain analysis platform Glassnode also noted that Bitcoin’s current behaviour demonstrates “a potential turning of the macro market tides is underway.” As per the firm, BTC was now consolidating above the on-chain cost basis of several cohorts after a month of volatile price action. This put average BTC holders into a regime of unrealized profit.
Accordingly, the last 12 months had seen a persistent rotation of capital from Long-Term Holders to the Short-Term Holder cohort, which, as per the firm, were “signs that full detox of exuberance has taken place, and a cyclical transition may be underway.”
“With past cycles as a guide, the road ahead remains arduous, with key examples being 2015 and 2019. These transitional periods have historically been characterized by an extended macro sideways market, littered with local volatile moves, usually in both directions,” wrote Glassnode.
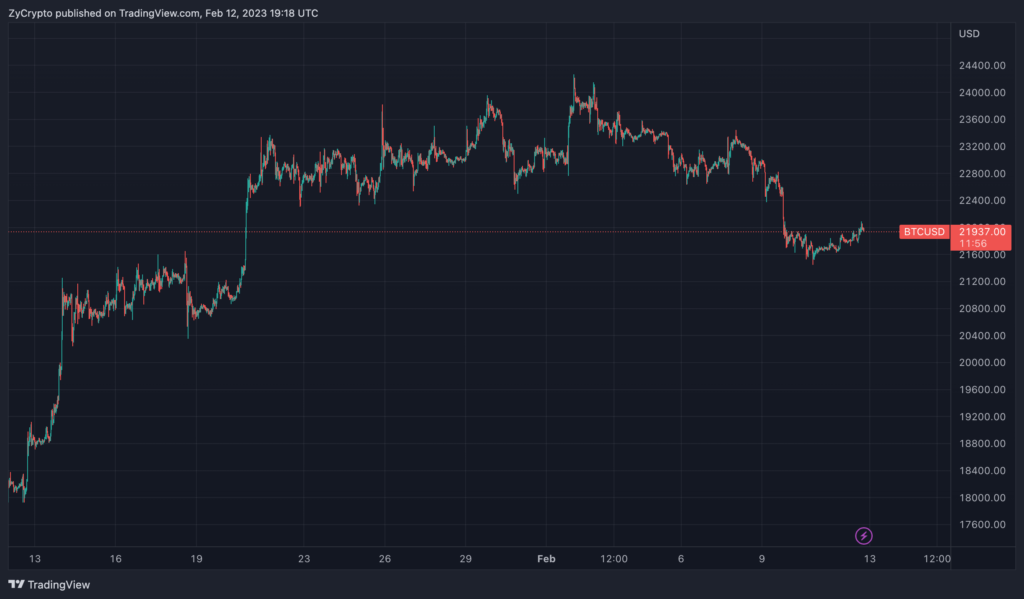
At press time, Bitcoin was trading at $21,965, up 1.33% in the past 24 hours.


