
 and Bitcoin Cash (BCH) Price Analysis")
Bitcoin Cash (BCH/USD)
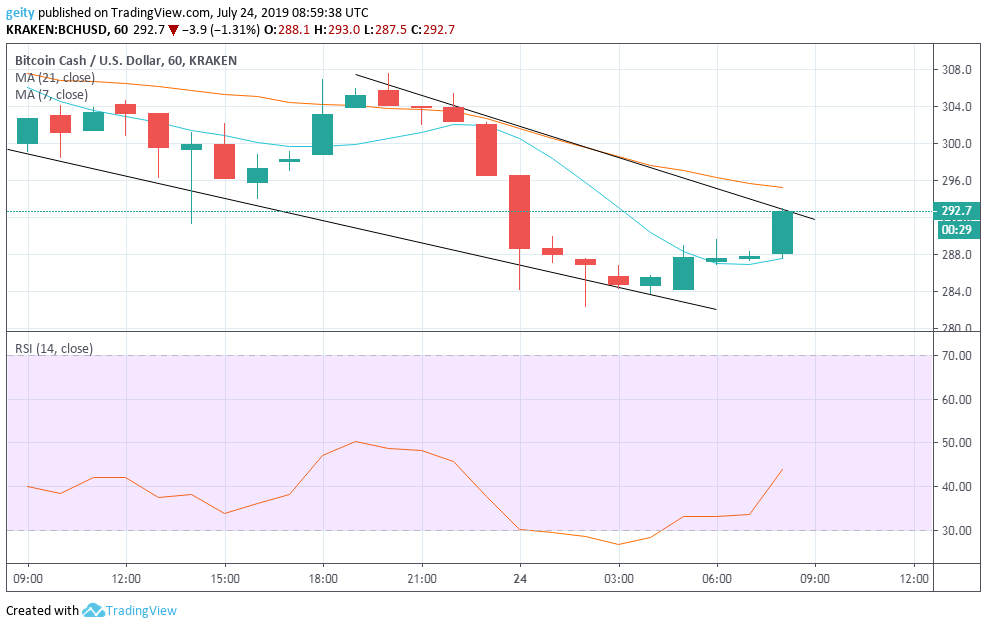
BCH/USD has exhibited a bearish outlook over the last 24hrs. BCH has recorded an intraday down surge of 3.9%. The pair’s price began the sell-off trading at $302.7, which was followed by a strong drop to the current price of $290.9. Additionally, it has a circulating supply of 17.9 billion with a market capitalization of $5.2 billion over the last 24hrs.
The horizontal channels confirmed the downward pressure. The support zone has been lowered from $295.6 level to $284.0 level that also signaled a bearish trend. From 0000h to 04:00, the RSI indicator was seen below level 30 that indicated an oversold market condition. This also showed strong sellouts.
At the moment, the RSI indicator seemed to have recovered, having moved from a low of 27 to a high of 44 and indicates a reduction in bearish pressure. Thus investors are most likely not willing to go short since they are anticipating for a better price.
Price Prediction
Currently, all the indicators are pointing at an incoming Bull Run. With the 7-day MA acting as the price support and the RSI indicator is currently heading north which signals an upward price rally. New target should be set at $300.

Bitcoin SV (BSV/USD)
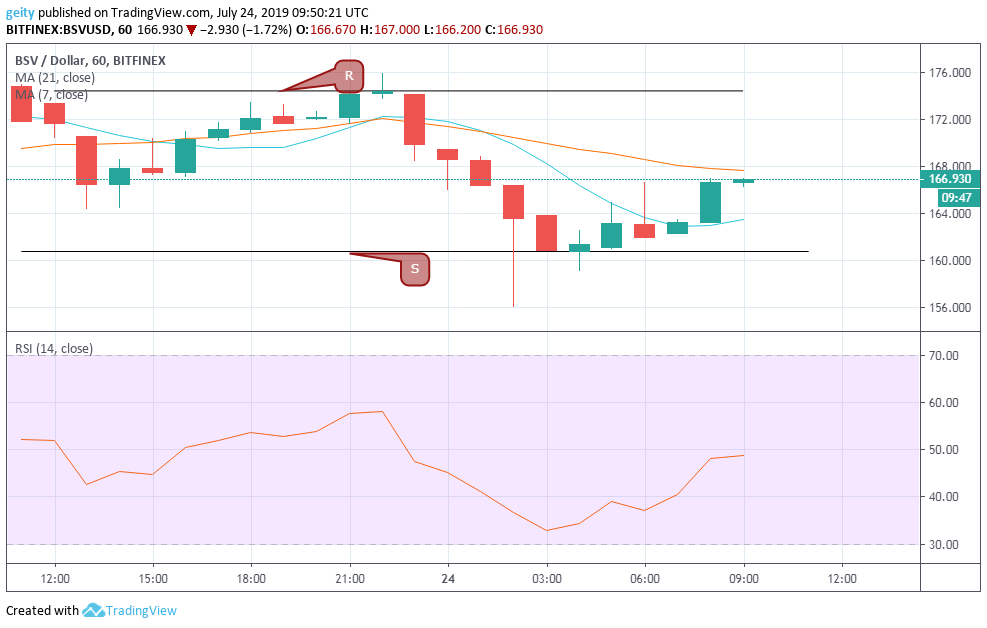
BSV/USD has undergone a sideways trend over the last 24hrs. The horizontal channels supported the sideways momentum. Apparently, the intertwining moving averages signals indecision in the market, thus lack of market momentum. On an hourly chart, BSV recorded an intraday drop of 2.9%, having begun trading at $171.84.
The pair’s price saw a massive downfall that dipped the price down to a low of $156.00. It later gained momentum and shifted the price slightly up to the current price of $166.930. This defined a key resistance level at $174.442 and a key support level at $160.768. At the moment, the RSI indicator is heading north, having hit a high of 48 from a low of 33 that indicated increase buyouts.
Price Prediction
Currently, the 7-day MA is acting as the price support this signals incoming bullish rally. However, a short-term consolidation period is likely to be seen before a breakout. New target should be set at $172.000.
Bitcoin (BTC/USD)
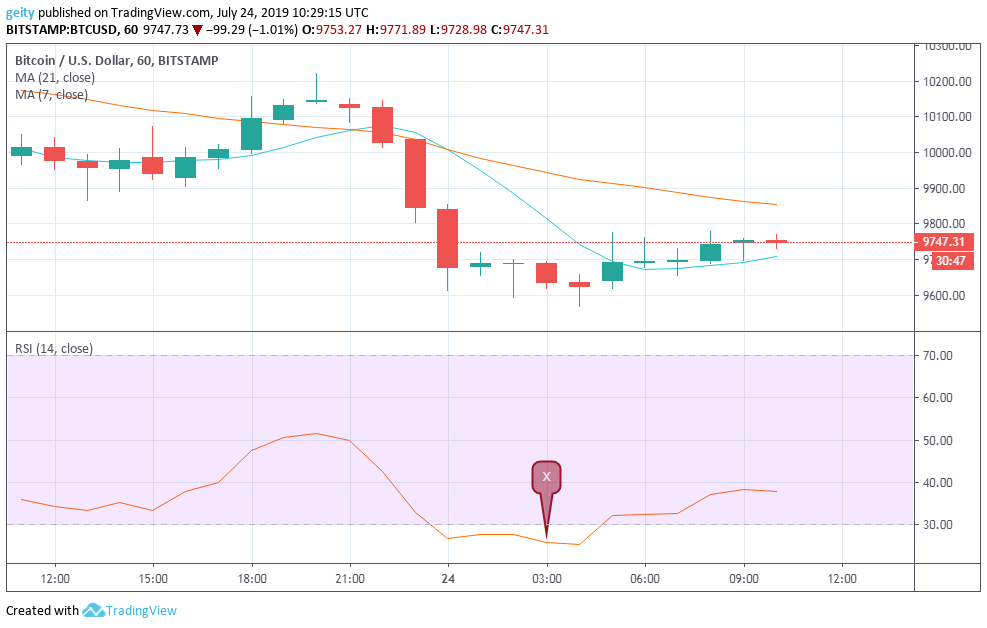
Over the last 24hrs, BTC/USD pair recorded a bearish outlook. The top cryptocurrency is down by 2.7 percent throughout the intraday. The downward pressure has been supported by the 21 day MA that is currently gravitating above the 7 day MA.
Support level has been dropped from $9924.53 to $9624.88 that also indicated a bearish pressure. Presence of a Doji was also seen severally that signaled indecision in the market. The RSI indicator X was seen below level 30, which indicated an oversold market momentum. In addition, the bears had dominance to the market momentum in the last 24hrs.
The RSI indicator later recovered and hit a high of 39 that showed a reduction in selling pressure. This also indicates that investors are anticipating for better prices.
Price Prediction
At the press time, the 21 day MA is still above the 7 day MA, this indicates further downtrends in the next few hours. New targets should be set at $9500.


