
 Technical Analysis Breaks out of $6,609 , Bullish Wave Incoming")
BTCUSD Medium-term Trend: Ranging
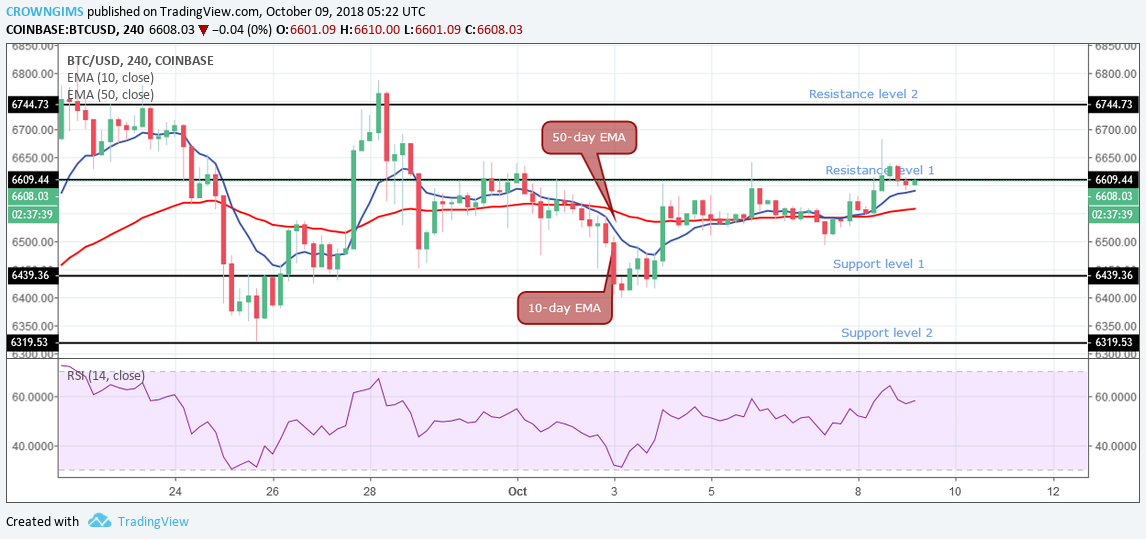
Resistance levels: $6,609, $6,744, $6,900
Support levels: $6,439, $6,319, $6,228
The BTCUSD pair was in a ranging trend yesterday in its medium-term outlook. The coin has been range bound between the resistance levels of $6,609 and the support levels of $6,439 in the last ten days.
Before the ranging trend, the price of Bitcoin fell from the upper resistance level of $6,744 to the support level of $6,439 where the price was rejected by the pressure of the buyer and the price experienced gradual bullish momentum. It was at this range bound zone that the price pulled back to the support level of $6,439.Today, the cryptocurrency is fluctuating below the resistance level of the price range at $6,609.
In case the price breaks out to the north from this level, there are indications that it will find its high at the resistance level of $6,744.Should the bulls defend this zone and the price bounces back, traders should initiate short trades and stop-loss orders above the resistance level of $6,744. You can exit your short trades at the support level of $6,609 or when the price reverses.
On the other hand, In case the resistance level of $6,609 holds, the BTC will attempt to reach the support level of $6439. Should the bears increase their momentum and break the support level of $6,439 the price will be exposed to the lower support level of $6,319.
However, the Stochastic Oscillator 14 is below 40 levels with its signal lines pointing to the north which indicates a buy signal. The price is above the 10-day EMA and 50-day EMA which indicates that the price is rising.
BTCUSD Short-term Trend: Ranging
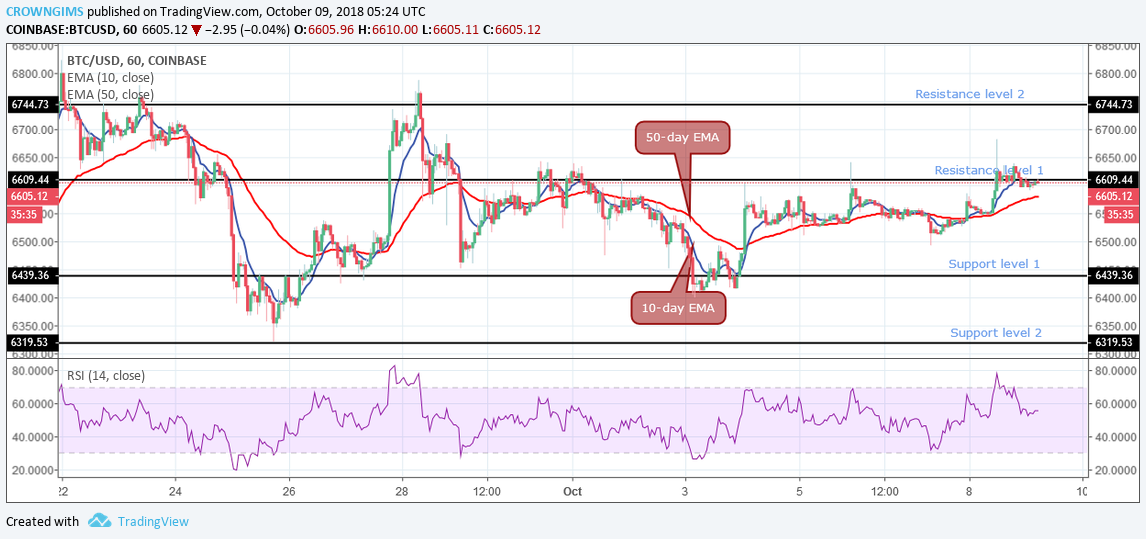
On the 1-hour chart, the BTC price is in a sideways trend. The price was rejected at the resistance level of $6,609 by the bears with the formation of bearish engulfing candles and fell to the support level of $6,439. More buyers came into the market and pushed the price back to the previous high and commenced a range bound movement.
In a ranging market, traders are expected to trade the key levels of the market in order to make partials profits. Stop loss orders are put in place to manage sudden price breakouts. Meanwhile, the Stochastic Oscillator period 14 is below 80 with its indicator lines pointing downward which indicates that the market is overbought suggesting bears may take control of the market.


