
, and Electroneum (ETN)")
Bitcoin (BTC/USD)
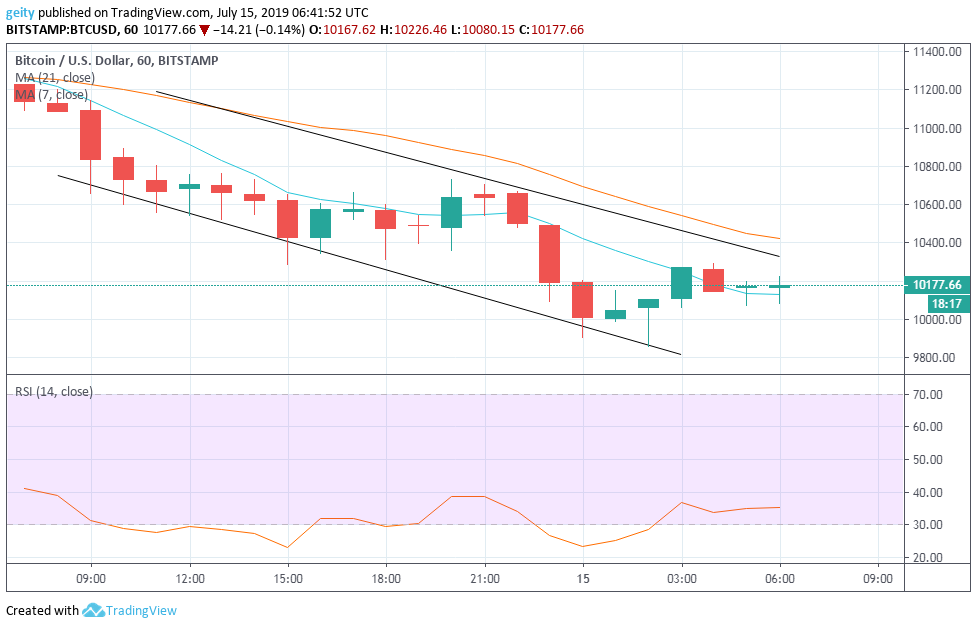
In the hourly chart, the BTC/USD pair underwent intense downward pressure. The pressure was bolstered by the 21 day MA that was seen trading above the 7-day MA. This indicated a bearish sign. BTC had begun the sell-off at $11,134 and is currently trading at $10,177 This showed that the pair’s price had fallen sharply by 8.6% over the past 24hrs.
Since the dip, BTC/USD pair had found key support at $10,408 and resistance at $10,662. That was followed by a breakdown that breached the support level. The support level was later shifted down to $9,998 that showed increase bearish pressure. The drop in BTC price showed a negative impact on investors.
The Relative Strength Index was seen below level 30 at several instances that indicated an oversold market momentum. This also noted that the bears were the ones dominating the market momentum over the last 24hrs.
The RSI indicator later recovered, starting from 15:00 where it gained stability and climbed up from 22.79 to 35.65. This showed the possibility of recovery in the pair’s price.
However, the fall of the price of BTC could mark as an extension of the bearish pressure that the coin had first encountered in late June when the price rallied up to $13,800. That was followed by a massive breakdown that halted the upward momentum the market had been exhibiting for the previous months.

Forecast
The 21-day MA is still gravitating above the 7-day MA. This signals a further downward pressure coming in the next few hours. New targets should be set at $9,800. A stop-loss should also be set at $10,450.
Ethereum (ETH/USD)
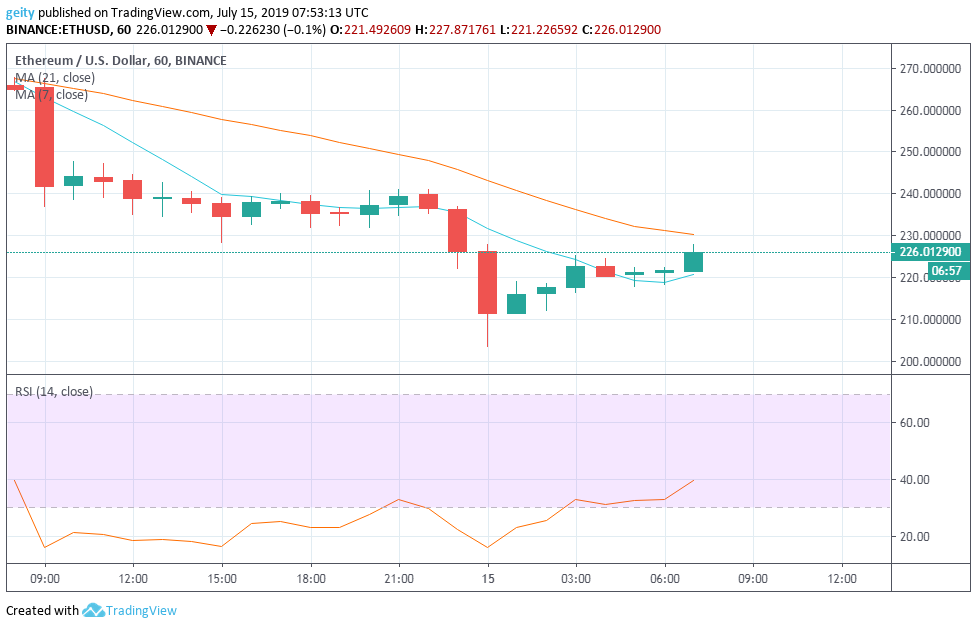
ETH/USD is trading down by 14.6% over the last 24hrs. It has a current price of $226 that is significantly down from $264. The downward pressure was supported by the 21 day MA that was seen gravitating above the 7-day MA over the past 24hrs.
ETH/USD saw a dip that led to a short-term period of consolidation that placed minor support at $234.08 and resistance $244.83. This was later followed by a further breakdown before gaining momentum and put ETH to its current price of $226.01.
The Relative Strength Index indicator was also seen most of the time below level 30 that signaled an oversold market momentum. That showed that bears had the upper hand. At the moment, the RSI indicator is tending north that shows the unwillingness of investors to go short longing for much better prices.
This bearish pressure could perhaps be due to the extended fall of BTC that find support at $11,000 level whereby it dipped further down by almost 10% towards $10,000 which could have been the reason why significant altcoins are trending lower thus, including Ethereum.
Forecast
At the moment, the RSI is pointing towards Northway indicating incoming upward rally. The 7-day MA has bent and is acting as the price’s support, which is also a bullish sign. New targets should be set at $240.
Ripple (XRP/USD)
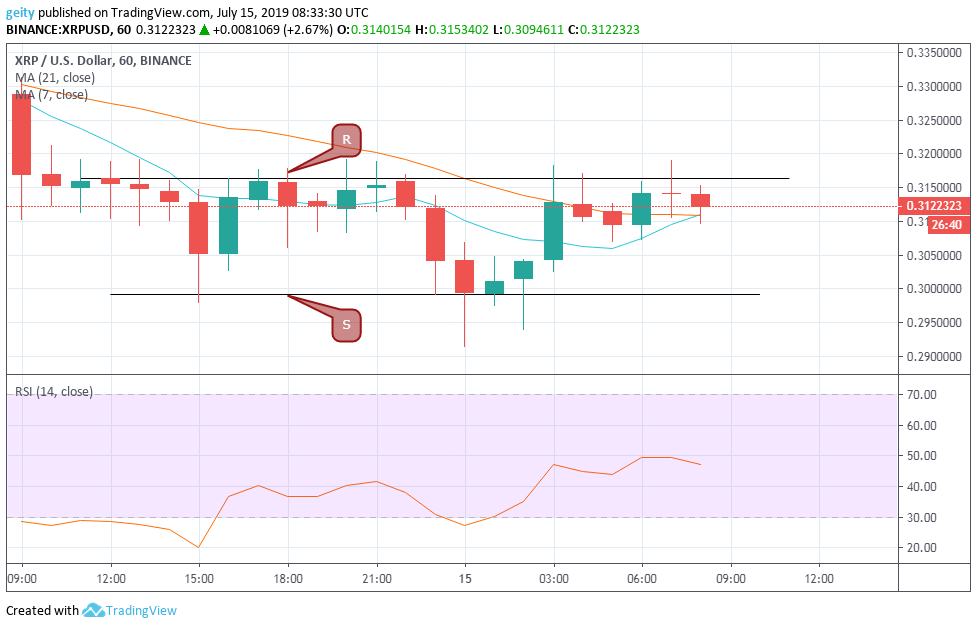
On an hourly chart, XRP/USD pair is down by 1.47% in the last 24hrs, having moved from $0.31690 to the current price rate of $0.31223. XRP/USD also exhibited a downward price movement that was supported by the 21 day MA that was seen gravitating above the 7-day MA.
The pair’s price underwent a massive fall that dipped the price where it rallied to a low of $0.29134. However, the coin managed to recover from a strong sell-off and climbed up to a high of $0.31834.
The RSI indicator that moves up from the oversold territory reflected this since it was below level 30 where it later moved up to level 49.75 that indicated increased buyouts. This placed resistance level at $0.31635 and support level at $0.29914. The RSI indicator is currently heading south showing that the bears are in control.
Forecast
At the moment, the 7 day MA looks set to cross the 21-day MA that indicates a bullish sign. The resistance level of $0.31 is more likely to be broken. New targets should be set at $0.34.


