

BITCOIN (BTC-USD)
In the last 24hrs Bitcoin has exhibited a bullish outlook which is as a result of a bullish regular divergence pattern that was signaled simultaneously.
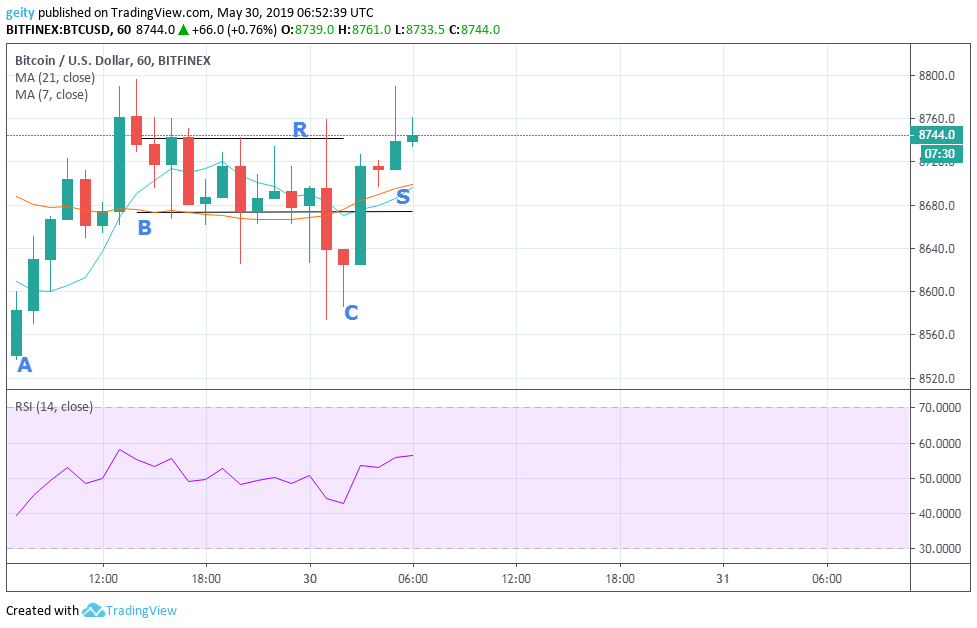
Despite a sideways trend that has been supported by the 7-day MA and the 21 day MA which are intertwining, an upward price rally is observed. BTC /USD pair began trading on 29 May 08:00 at $8629.5 (A) against the current price of $8644.0.
This was later followed by a breakout and since buyers were in control they shifted the price action further up to close at $8760.7. The significance level was, therefore, stood at; resistance level $8741.3 and support level at $8673.7. Later on, from B to C a bearish accumulation was encountered due to high selling pressure that led to decline price performances that further dip to a low of $8585.0 (C).
At around 30th May 03:00, presence of a bullish marubozu candle is encountered that reflected a strong buying pressure from traders thus leading to an upward price rally to the current price of $8644.0

FORECAST
The RSI is trading below the north angle in the last few hours, this shows the possibility of a price correction. The 7-day MA is moving beneath the 21-day MA during the last hour, thus indicates a further decline. New target should be set at $8451.
ETHEREUM (ETH-USD)
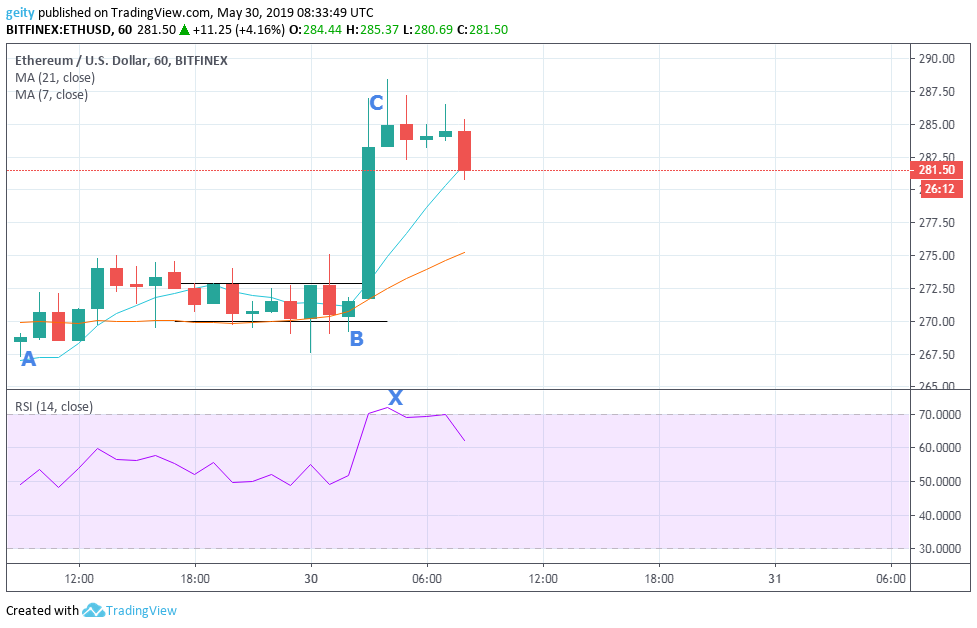
A bullish market rally is in the last 24hrs where ETH began the day trading at $268.84 (A).
This was later followed by a period of consolidation from (A to B), that reflected luck of market momentum.
Neither the bulls nor the bears had the upper hand at that period of time thus resulting in a sideways price movement. Resistance level was placed at $272.88 and support level at $269.98, the significance level was tested severally.
At around 30th May 03:00 buyers took over control leading to strong buying pressure thus pushing the price up to a high of $286.97 (C). The RSI X is seen above level 70 indicating overbought market. Later on, a sideways price rally is seen that led to the current price of $269.50.
FORECAST
The RSI is heading south during the last hour confirming a decline price rally in the next few hours. The uptrend is likely to be sustained since the 7 day MA is still above the 21-day MA. New support should, therefore, stand at $260.70.
LITECOIN (LTC-USD)
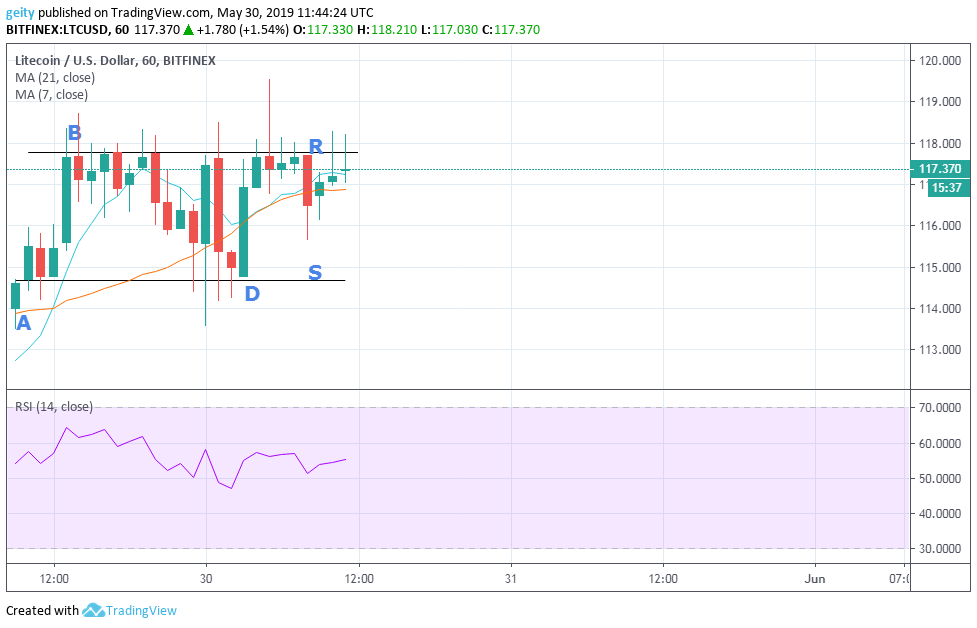
A ranging market is observed and buttressed by a horizontal channel on an hourly chart. The RSI is seen most of the time above 50 thus reflecting buying pressure from traders. LTCUSD pair began trading at $114.629 (A). A break out later followed, where traders shifted up the price rally past support level $114.679 (S) to reach a high of $118.350 (B), resistance level was, therefore, stood at $117.755 (R).
At around 29th May 20:00 a break out was encountered with a bearish accumulation pattern that dips the price momentum to a low of $114.230 (D).
A bullish engulfing candle was later on encountered, promoting rising of price momentum to a high of $118.280.
LTC current price is $111 hence is down by 4.30%; the recent price rally may be due to the recent update of litecoin protocol, that promoted transaction to be as low as half a cent.
FORECAST
A bullish signal is likely to be seen since the 7 day MA is still above the 21-day MA. The RSI indicator is also heading north during the last hour reflecting an upward price momentum. New support target should be placed at $105 and a stop-loss slightly below the target for security in case of a breakdown.


