

Binance Coin has seen a small 0.22% price increase over the past 24 hours of trading. The cryptocurrency is currently exchanging hands at a price of $9.76 after suffering a small price drop totalling -1.43% over the past 7 trading days.
Binance Coin is a token used to receive discounts on trading fees when using the exchange Binance. The Binance team have committed to using up to 20% of their profits each quarter to buy back supply of BNB coins off of the market. They will continue to do this until the coin supply for BNB reaches 100 million. The team have recently just conducted their 5th quarterly buy back scheme in which 1.64 million BNB tokens were burnt.
At the head of the current month, the Binance team have also committed to donating 100% of their listing fees to charity. The payment for listing for cryptocurrency projects to the Binance platform has been been a long controversial topic. The donation of the listing fees to charity marks a step further in the competence and confidence in the Binance team.
Binance Coin is currently ranked in 14th position in terms of overall market cap across the entire industry. It currently holds a total market cap value of $1.28 billion after the 15 month old coin suffers a 28% price drop over the past 90 trading days. BNB is now trading at a value that is 60% lower than its all time high price.
Let us continue to analyse price action for BNB against the USD over the long term and ascertain how the market has been behaving.
Price Analysis
BNB/USD – LONG TERM – DAILY CHART
https://www.tradingview.com/x/TgmZaCuY/
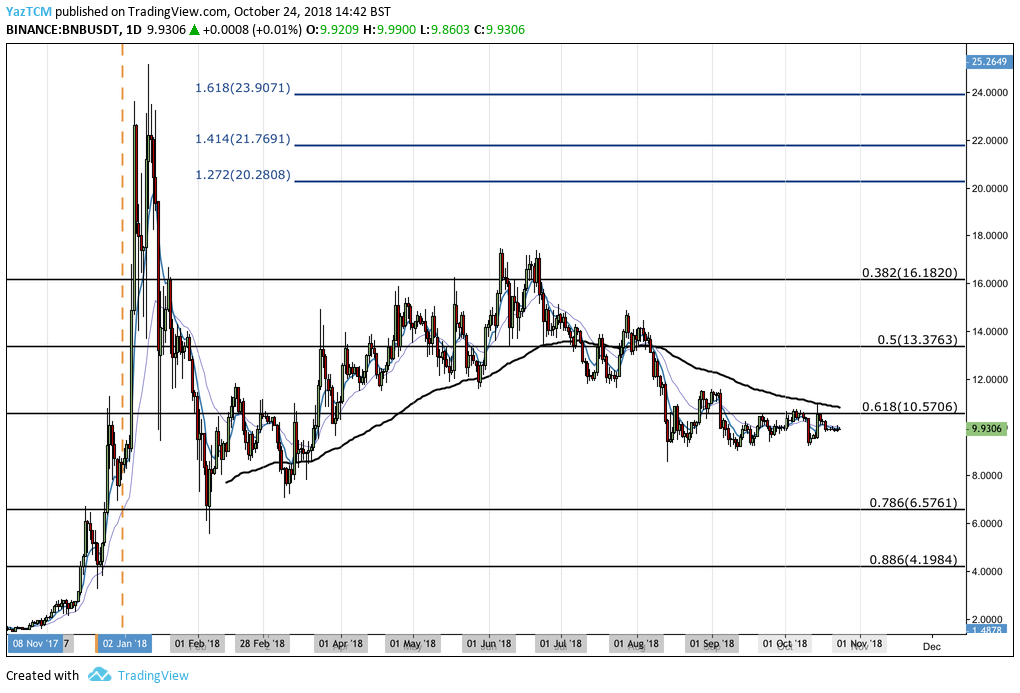
Analysing price action from the short term perspective, we can see that after placing the all time high, price action rolled over and began to decline aggressively. It had originally found a form of significant support when the market approached the long term .786 Fibonacci Retracement level priced at $6.57. As price action reached this area it reversed and proceeded to rally.
It continue to increase until meeting further support higher at the .382 Fibonacci Retracement level priced at $16.18 where the market rolled over once again and started to decline.
Price action is now trading at resistance provided by the .618 Fibonacci Retracement level priced at $10.57 and has struggled to overcome this resistance for the previous 2 months.
Let us continue to analyse price action a little closer over the short term and highlight any potential support and resistance areas.
BNB/USD – SHORT TERM – DAILY CHART
https://www.tradingview.com/x/v11MZDY3/
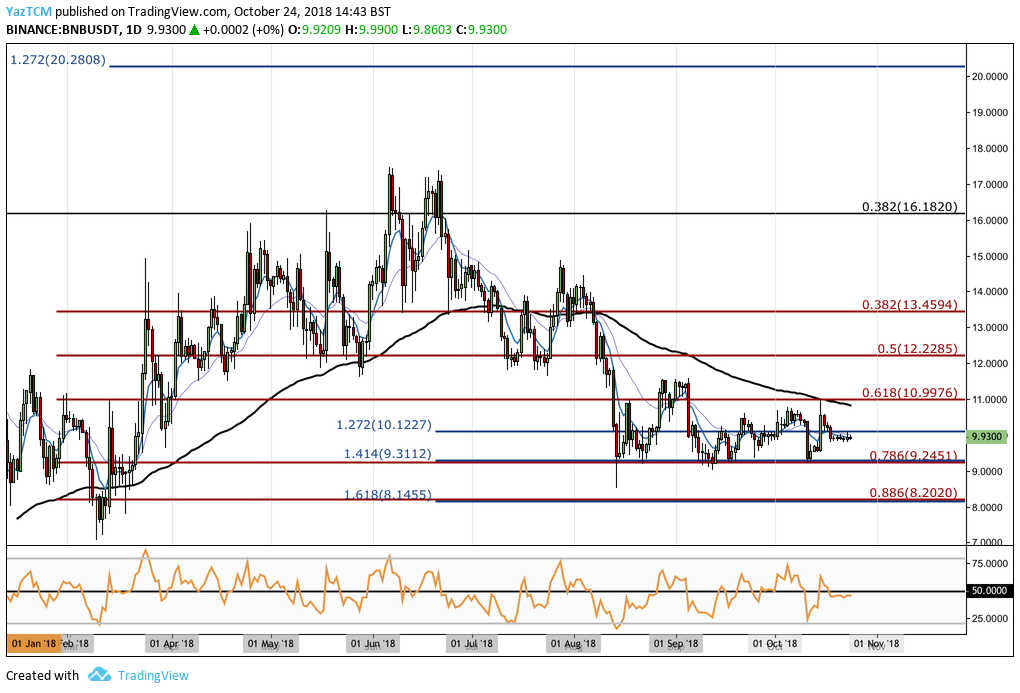
Analysing the market from the short term perspective above we can see that price action had experienced a bullish run when the market started from a low of $7.06 on the 9th of March 2018 and extended to a high of $17.44 on the 7th of June 2018. This was a price increase totalling 144% from low to high.
The market had then rolled over and began to decline until meeting support originally at the short term .5 Fibonacci Retracement level priced at $12.22 during July 2018. The market continued to penetrate beneath this support during August 2018 until finding further support below at the .786 Fibonacci Retracement level priced at $9.24. We can see that this level of support has provided stability for the market for the past 2 and a half months. It is important to highlight that this level of support is further bolstered by a downside 1.414 Fibonacci Extension level priced at $9.31 further adding to the expected level of support in this area.
Price action for BNB/USD has now been trapped within a range bound between the $9.24 handle as the lower boundary and the short term .618 Fibonacci Retracement level priced at $10.99 as the upper boundary.
Price action is currently trading at resistance at the downside 1.414 FIbonacci Extension level priced at $10.12, if the bulls can push price action above this they will meet initial resistance at the upper boundary of the trading range priced at $10.99.
If the bullish momentum can continue to press price action higher above $11, then we can expect further resistance above to be located at the short term .5 and .618 Fibonacci Retracement levels priced at $12.22 and $13.45, respectively. IF the bulls can go on to break above $18 then we can expect more resistance at the 1.272 Fibonacci Extension level priced at $20.28.
ALternatively, if the bears step in and push price action lower we should expect immediate significant support below to be located at the .886 Fibonacci Retracement level priced at $8.20. This area of support is further bolstered by the downside 1.618 Fibonacci Extension level further adding to the expected support in this area.


