Binance coin has experienced a small increase in price over the past 7 trading days, rising a total of 2.30% over the period. Binance coin is currently exchanging hands at a price of $13.15, at the time of writing and has seen a small price drop of 0.8% over the past 24 hours.
Binance coin, BNB, is the coin behind the exchange Binacne. Binacne was created in 2017 and the ICO for BNB raised $15 million. BNB is an Ethereum based token that provides discounts to users for fees on the Binacne platform. The discount is currently 50% but will shortly halve to 25%.
The 12 month old coin, BNB is currently ranked at 17th place with a total market cap value of $1.50 billion. BNB has experienced a price decline of 17.88% over the past 30 trading days.
Let us continue to analyse price action for BNB over the long term.
Price Analysis
BNB/USD – LONG TERM – DAILY CHART
https://www.tradingview.com/x/9YgN8b5Y/

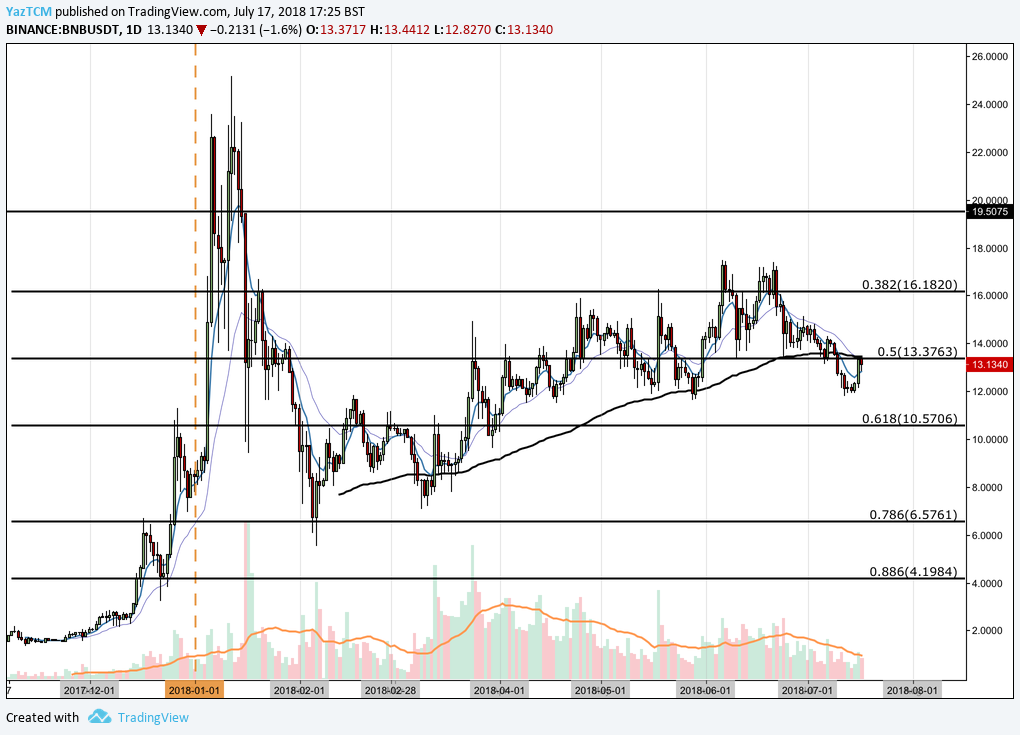
Analysing the market from the long term perspective above, we can see that BNB had experienced a significant bullish run toward the end of 2017 when price action rose from a low of $1.34 on the 12th of November 2017 and rose to a high of $25.18 on the 12th of January 2018. This was an epic price increase of over 1,750% from low to high.
We can see that BNB went on to depreciate after placing this all time high until it found support at the .786 Fibonacci Retracement priced at $6.57 in February. This is a Fibonacci Retracement measured from the entire bullish run seen from November 2017 to January 2018.
After rebounding from the .786 Fibonacci Retracement, the market went on to make another consistent bullish run and didn’t return to these levels since.
We can see that the market is currently trading at resistance located at the .50 Fibonacci Retracement level priced at $13.37.
Let us continue to analyse price action over the shorter period closer to highlight any potential areas of support or resistance.
BNB/USD – SHORT TERM – DAILY CHART
https://www.tradingview.com/x/Xcp1sEmP/

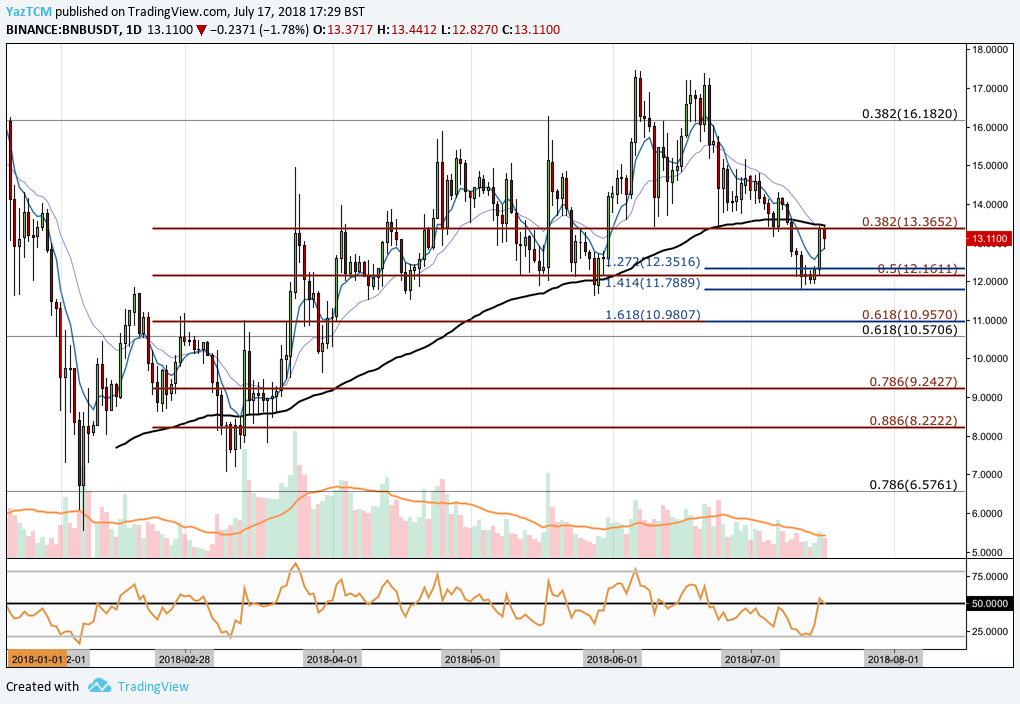
Analysing the market from a closer perspective, we can see that after bouncing from the long term .786 Fibonacci Retracement, the market went on to have another 5 month bullish run. We can see that the market rose from a low of $7.06 on the 9th of March and continued to extend all the way to a high of $17.47 experienced on the 6th of June. This is a price increase of 140% in value from low to high.
We can see that after placing the high in June, the market fell but found support initially at the short term .382 Fibonacci Retracement priced at $13.36, marked in red. This is a Fibonacci Retracement from the bullish run highlighteNd in the paragraph above.
As July started trading, the market fell through the .382 Fibonacci Retracement until it found support at the .50 Fibonacci Retracement priced at $12.16, where the market reversed aggressively.
It is also important to highlight that this area of support is bolstered by the 1.414 Fibonacci Extension priced at $11.78, drawn in blue. This is a Fibonacci Extension measured form the initial bearish leg witnessed in June.
The market is currently trading at resistance marked by the .382 Fibonacci Retracement level, if the bullish momentum can break the market above this level then the nearest point of expected resistance is located at the long term .382 Fibonacci Retracement level priced at $16.18.
Alternatively, if the resistance proves to be overpowering for the market at $13.36 and causes it to roll over, near term support is expected at the .50 Fibonacci Retracement priced at $12.16. Further support below this level can be found at the .618 Fibonacci Retracement priced at $10.95.
The technical indicators are producing neutral signals at this moment in time. The RSI is currently trading at the 50 handle, if it can break above 50 this would indicate that the bullish momentum within the market is beginning to build.


