
 Still proving Different Despite Being Kicked Out Of Top Ten Ranking")
Resistance levels: $0.07, $0.08, $0.09
Support levels: $0.06, $0.05, $0.04
ADA/USD Long-term Trend: Bullish
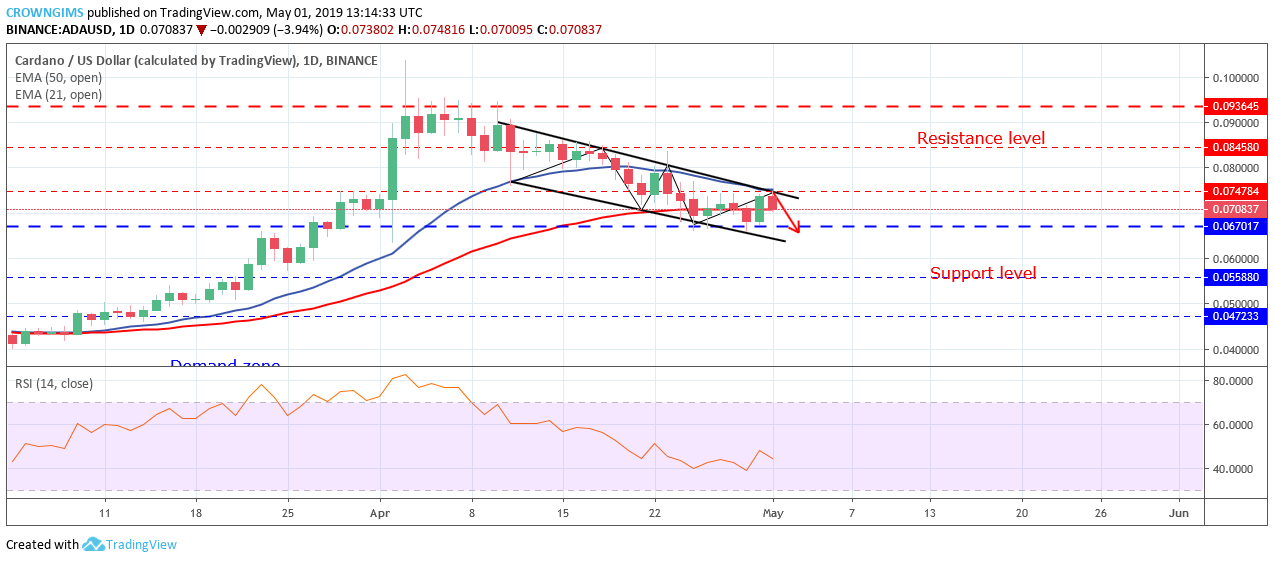
ADA/USD is on the bearish trend on the Long-term outlook. The Bullish momentum that started on March 09 pushed the coin to reach a high of $0.09 on April 03. The bulls’ momentum became weak and the coin started consolidating at $0.09 level for seven days.
The Bears gained enough momentum and pushed Cardano price to break down the $0.08 and $0.07 price levels. The bearish movement on the Cardano market has resulted in the formation of descending channel pattern making lower lows movement.

At the moment, the ADA price is trading in-between the 21 periods EMA and 50 periods EMA with the daily bearish candle. The coin is making an attempt to cross the two EMAs downside as a sign of a bearish trend.
Meanwhile, the Relative strength Index period 14 is above 40 levels with the signal lines point down to indicate sell signal. Should the Bears maintain or increase their pressure, ADA price will range down and find its low at $0.06 – $0.05 price level. In case the support level of $0.06 level holds, ADA price may bounce and face $0.07 level.
ADA/USD Medium-term Trend: Bearish
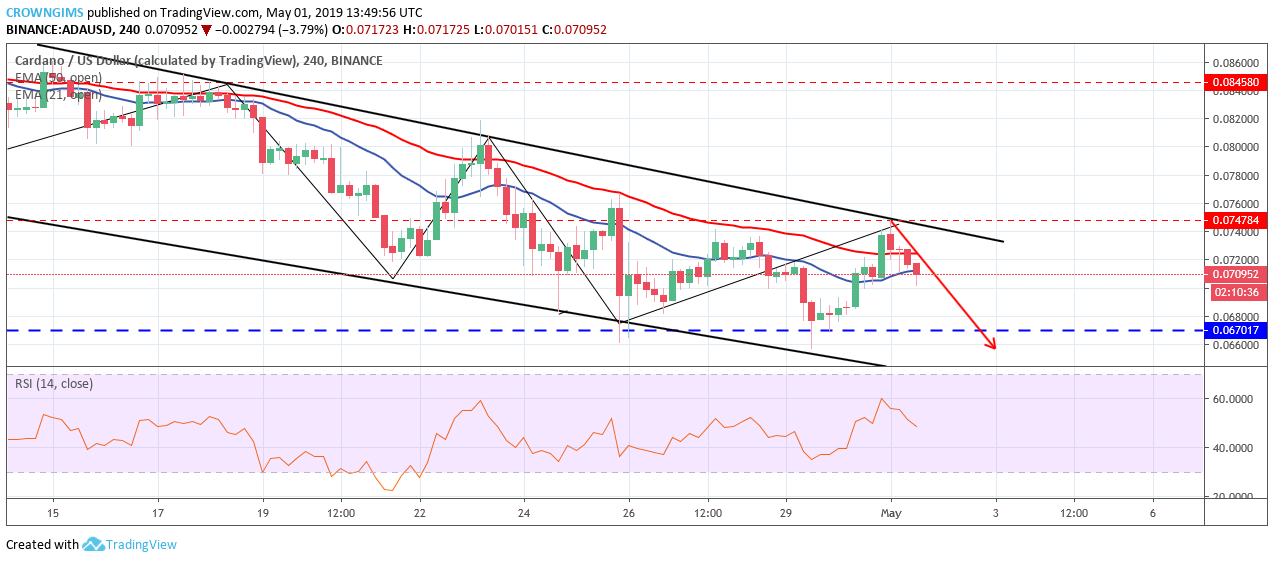
On the Medium-term outlook, ADA is on the bearish trend. On April 18, ADA price touched the resistance level at $0.08 and could not break up the level; it bounced back and rolled down the descending channel.
It penetrated the $0.07 level to touch the lower trend line of the channel where it bounced and touch the upper trend line. ADA market closed yesterday bullish but opened today with bearish momentum at $0.07 level. The coin is currently moving towards $0.06 price level.
The two EMAs are sloppy downward with the coin trading below the 21 periods EMA and 50 periods EMA as an indication of the Bears’ momentum in the Cardano market. The Relative strength Index period 14 is above 40 levels with the signal lines pointing down to indicate sell signal.


