- XRP achieves a high of $0.35499
- BTC Targets $4000 level
- BNB gets over $10 level
XRP/USD

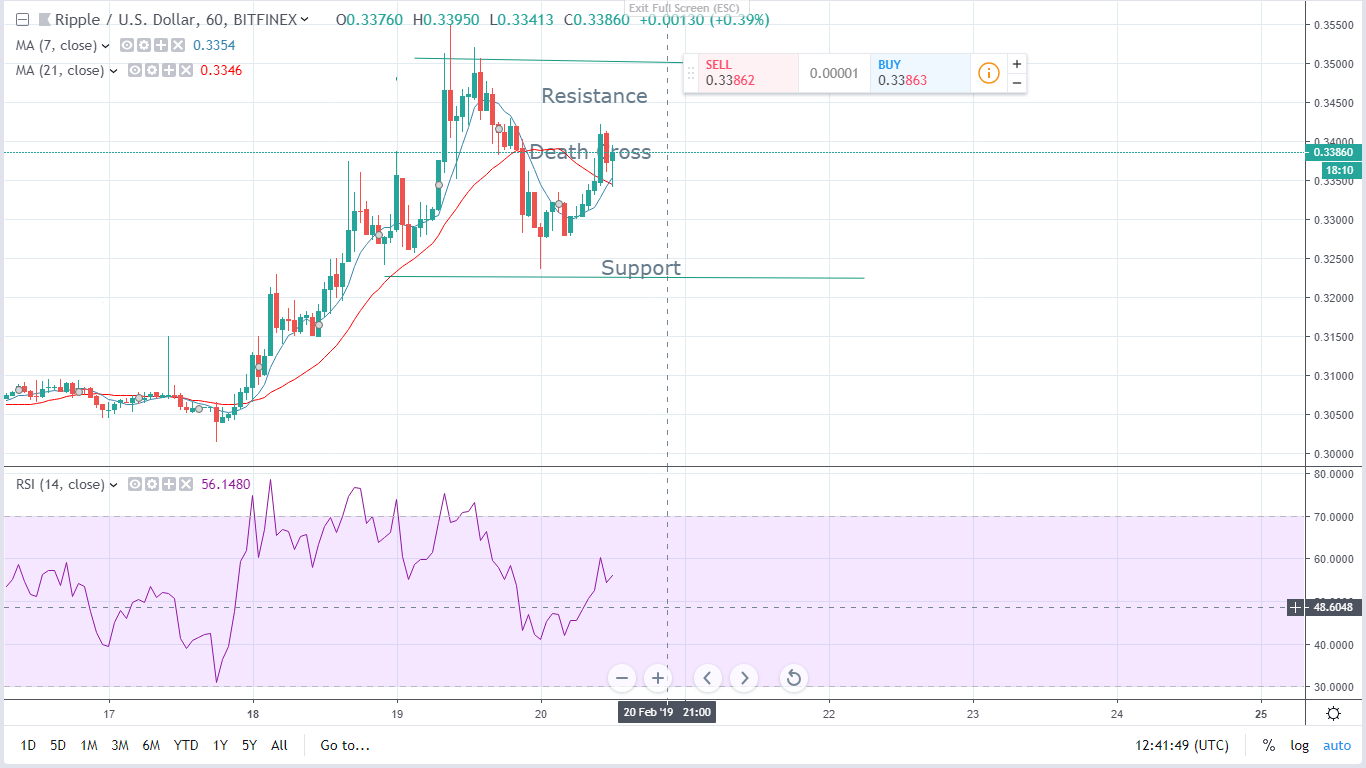
The rally by XRP in the last few days seemed to have gained momentum as the currency yet again achieved new highs, before tracing its way back to its current level of 0.3380 as of going to press. XRP managed to weather off the bearish engulfing at the dawn of 19th as the bulls managed to strike a price reversal on the upwards and pushed the currency price to a new high of 0.35499.
This didn’t last for long though as the bears came calling and pulled the price down to a low of 0.32820. Later, a death cross pattern was formed when the 21 day MA crossed over the 7 day MA seemingly signaling that the price would fall down even further. True to this, the bears pulled the price further down to a low of 0.32363.
XRP Forecast
Looking at the Moving averages, it seems that an intertwining is imminent.The RSI is between 40 and 60, seemingly portraying that the currency is set to trade sideways. This scenario would be ideal for an intra-range strategy with support levels at 0.32363 and resistance at 0.3521.
BTC/USD

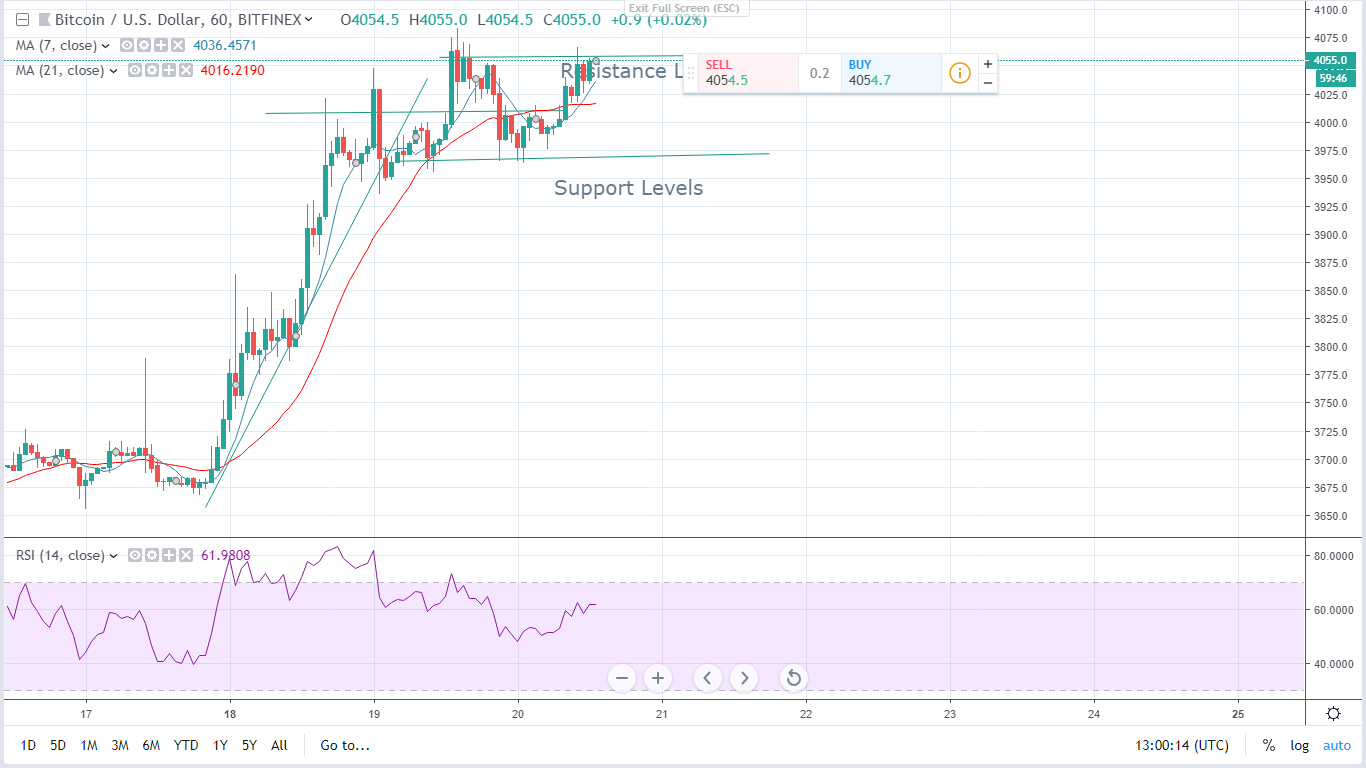
The price of BTC seems to be striving to achieve and outlive the 4000 territory. Even though there have been instances on the last 24 hours when the bears have pulled the priced below the 4000 mark, the price is currently above $3980 with its next target set for $4000. The RSI is at around 60 seemingly signifying that the price should be headed for consolidation before the next rally. The 7 day and 21 day MAs are also seemingly getting intertwined. This may portray that sideways trading may be in the offing.
BTC Forecast
The current scenario is ideal for range bound strategies that would set the resistance levels at 4050-4100 and support at 3950-4000. Traders can go long if the price bounces back from the support levels and go short if it pulls back from resistance levels.
BNB/USD

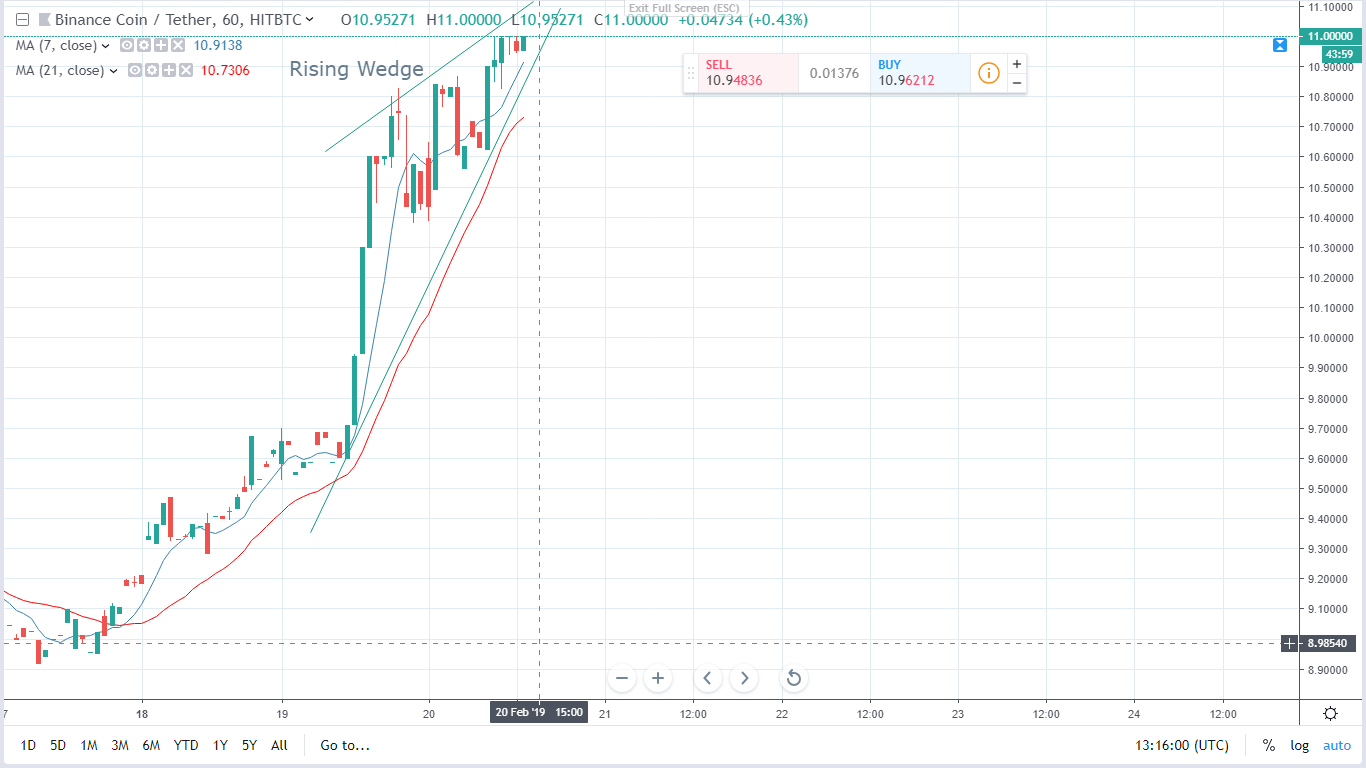
In the last couple of days, BNB has been experiencing bullish growth last seen in 2017 when it was launched. Currently, RSI levels are close to 70 seemingly portraying that the currency is at overbought levels. The 7 day MA is still maintaining a significant margin against the 21 day MA. Recent efforts by the bears to pull the price back below 10 have borne no fruit. As it is, the currency seems to find solid support at 10.50.
BNB forecast
Current candle stick formation seems to point to a rising wedge. This may mean that a breakout is imminent and the price may be pulled back. If a breakout occurs, traders can go short and put their support levels at 10.50.


