

Bitcoin is known for being an extremely volatile asset that can go up or down by more than 20% in one day. During the past bull rally that started in 2016, Bitcoin suffered numerous significant retracements of up to 40%.
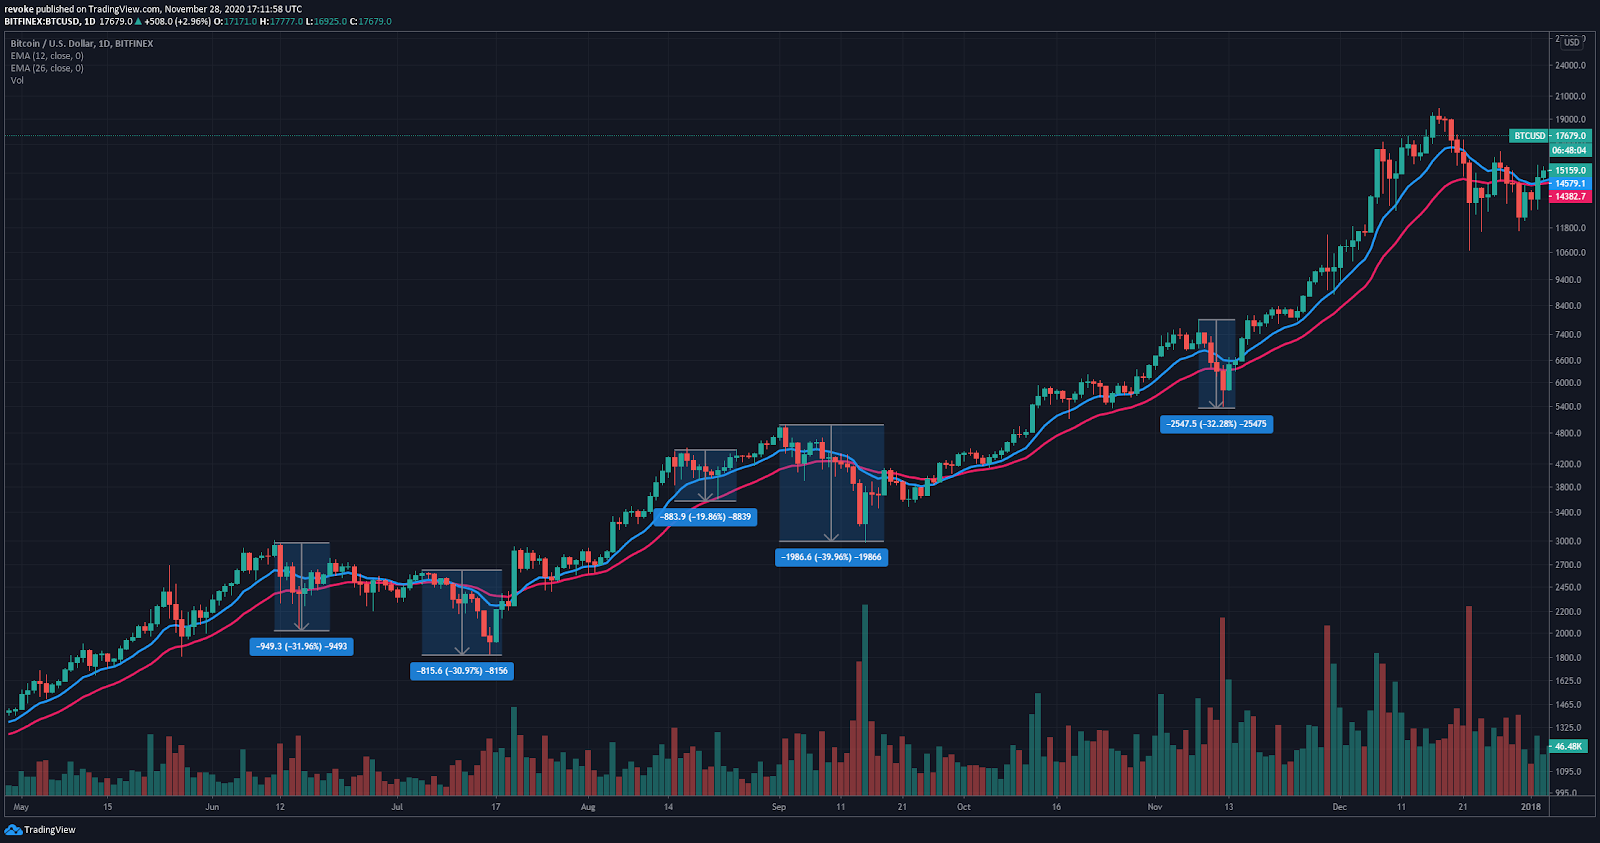
The average pullback that Bitcoin experienced during the last bull rally is around 34% which means this recent retrace is only around half of what was expected. Many analysts consider this pullback to be extremely healthy and, in fact, too small for Bitcoin.
However, there is one significant difference for the cryptocurrency market currently, the trading volume. Back in 2016 and 2017, the trading volume of Bitcoin and other cryptos was notably lower than it is now. This could be the difference between the usual 30% pullbacks and the recent one of 17%.
Bitcoin might need to retrace even lower for a massive bull rally
It seems that according to a chart posted by legendary Paul Tudor Jones, Bitcoin could be following the trend that gold had back in 1975 before its exponential surge.
The chart basically showcases two red lines between the first rally to the all-time high and the correction period. Bitcoin does seem to follow a similar trend after peaking at the end of 2017 at around $20,000.
It would seem that BTC needs to see an even stronger pullback before attempting to crack astronomical levels. However, as we mentioned above, the increasing interest from institutional investors and big names like Square and Stone Ridge is basically creating a new market.
We could very easily see Bitcoin simply continue climbing higher and reaching greater heights by the end of the year, despite only suffering one major 17% pullback. It’s also important to note that contrary to what happened in 2017, this rally has been far more balanced and quiet without too many crazy 20-30% days.


