
 Technical Analysis #007 - Tron rebounds from support once again approaching the $0.04 handle")
Tron has experienced a small price increase of 0.56% over the past 24 hours of trading. TRX is currently exchanging hands at a price of $0.036 and has experienced a 4.55% price hike over the past 7 trading days.
29 exchanges have now finally resumed Tron deposits and withdrawals after completing their migration process as the old Tron ERC-20 tokens were converted to Tron mainnet tokens. This should greatly improve liquidity once again as users are able to access their tokens that were previously “locked up”.
Another fascinating story out Tron this week is Justin Sun winning his own election to become a Super Representative on his own blockchain. Justin had announced that he would run to become a Super Representative and acquired the 100 million votes required for this to happen within 24 hours.
Super representatives are in charge of validating transactions and maintaining the blockchain. Tron users were not surprised that the CEO managed to acquire the votes required within 24 hours as they believed Justin Sun would make a great candidate.
Let us continue to analyse price action over the long term.
Price Action
TRX/USD – DAILY CHART – LONG TERM
https://www.tradingview.com/x/zN6VcJbA/
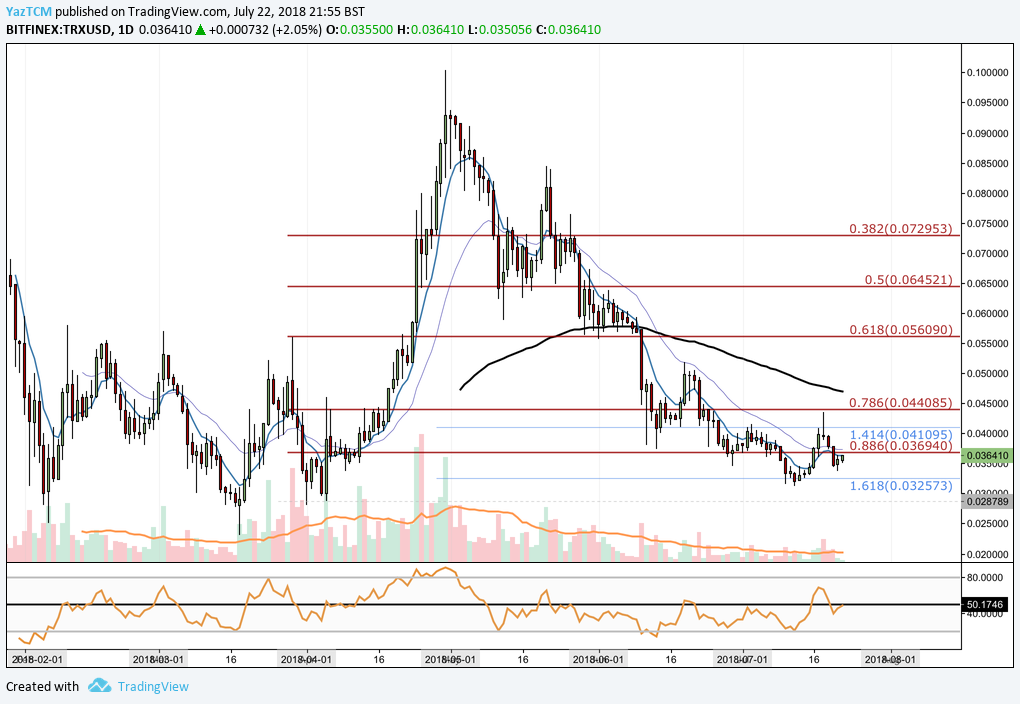
Analysing the market from the long term perspective above, we can see that Tron had experienced a respectable bullish run during April as price action rose from a low of $0.028 on April 1st to an all time high of $0.01 on the 30th of April. This was a price increase of 250% from low to high.
After placing this high, the market went on to fall during May, initially finding support at the .618 Fibonacci Retracement towards the end of may, priced at $0.056. This is a Fibonacci Retracement measured from the entire bullish run outlined above. It is also important to highlight that this area of support was bolstered by the 100 day moving average.
The market continued to break below the .618 Fibonacci Retracement and the 100 day moving average during June until it reached support at the .886 Fibonacci Retracement priced at $0.036.
In our last analysis we had stated that if the market would break below the .886 Fibonacci Retracement then near term support would be located at the downside 1.618 Fibonacci Extension priced at $0.032. During July price action fell below the .886 Fibonacci Retracement and hit our support area where the market rebounded.
Price action is currently trading at resistance just below the .886 FIbonacci Retracement priced at $0.036. If the bullish momentum can push price action above this level, we expect near term resistance to come in at the .786 Fibonacci Retracement priced at $0.0445.
This area of resistance will, once again, be bolstered by the 100 day moving average which is currently hovering slightly above the .786 Fibonacci Retracement. If we are to expect the market to continue further beyond this level then significant momentum will be required.
Alternatively, if the resistance at the .886 Fibonacci Retracement proves to be too overpowering for the bulls, we expect near term support to be located at the downside 1.618 Fibonacci Extension priced at $0.032.
The technical indicators are largely producing neutral signals at this moment in time. The RSI indicator is currently trading exactly on the 50 day moving average, indicating the indecision within the market. If the RSI can break above the 50 handle then we can expect the bullish momentum to continue.
Similarly, the moving averages are trading in a sideways manner, poised for a bullish crossover. As the 7 day EMA and the 21 day EMA are trading sideways, this indicates that the market has not yet made its decision on which way the trend would like to continue in. If the 7 day EMA can cross up above the 21 day EMA this would constitute a bullish crossover and the bullish momentum will increase.


, and Stellar (XLM) Price Analysis – Recovery Expected Above Major Support Levels")
 and Stellar (XLM) Weekly Price Performance Overview")
