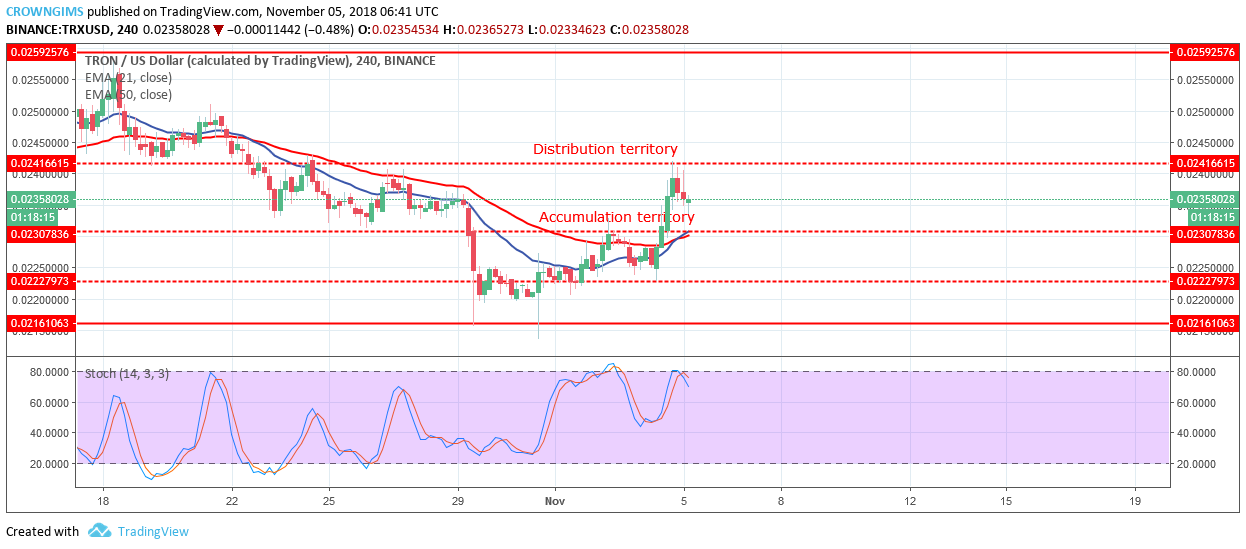
Distribution Territories: $0.024, $0.026, $0.028
Accumulation Territories: $0.023, $0.022, $0.021
TRX/USD Medium-term Trend: Bullish

TRX/USD is in a bullish trend. Yesterday, the strong bullish pressure after the formation of a bullish engulfing candle at the accumulation territory of $0.022 signaled the bulls return. Confirmation to the bulls’ takeover was seen as the next 4-Hour candle closed as a strong bullish candle above the two EMAs.
Increased bullish momentum led to the breaking of the former distribution level of $0.023. Yesterday’s high in the Tron’s market was the distribution territory of $0.024 as the bulls show exhaustion with a wick at the candle.
Today’s opening market candle is bearish showing the rejection of uptrend continuation at the distribution territory of $0.024 that may serve as a pullback. A pullback to the broken area is necessary for the market correction as this may guarantee uptrend continuation for the bulls to come back much stronger.
TRX is above the two EMAs, an indication of bullish pressure. However, the Stochastic Oscillator period 14 is at the overbought region at 80 levels with its signal lines points down indicates sell which may be a pullback. TRX may witness an upward price movement today in case the bullish momentum increase.
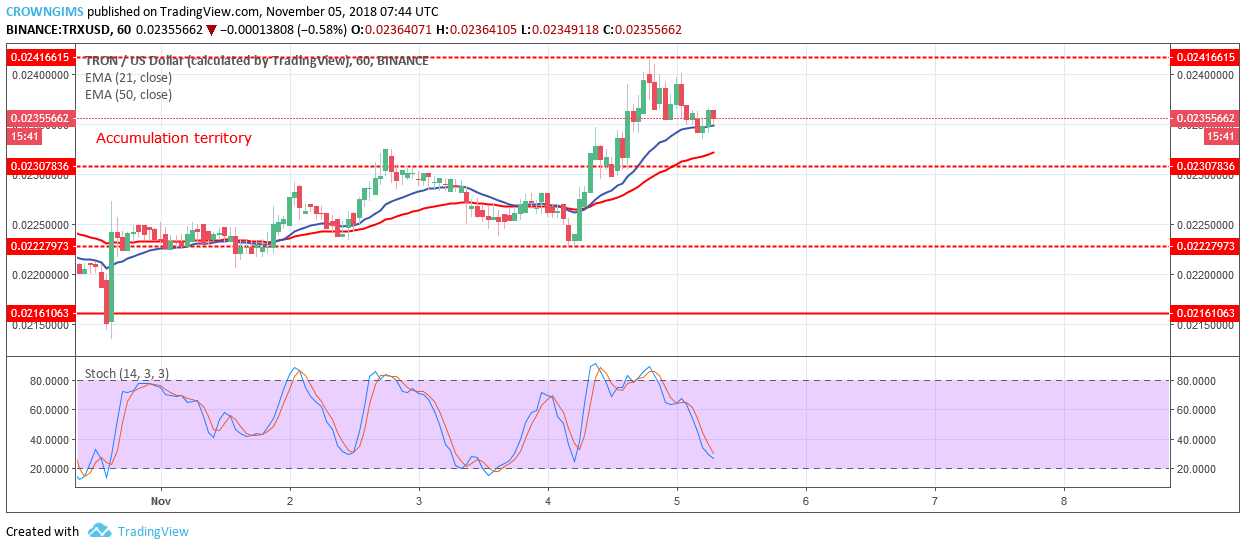
TRX/USD Short-term Trend: Bullish

TRX is bullish in the short-term. The return of the bulls was clearly seen on the 1-Hour chart as the bullish engulfing candle formed at the accumulation territory of $0.022 followed by many bullish candles yesterday. The 21-day EMA crossed the 50- day EMA confirming bullish pressure.
TRX price is above the two EMAs and the Stochastic Oscillator is closed to the oversold region with the signal lines points down which connotes sell signal which may be a pullback before TRX continues its uptrend movement.


