
 Price Analysis - February 13")
Tron (TRX/USD)
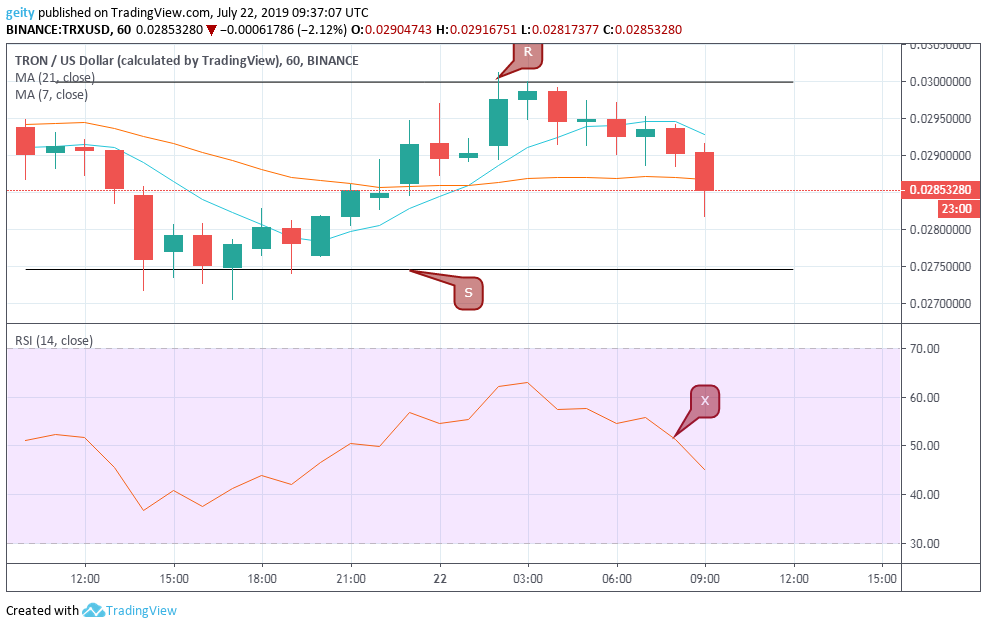
In the past 24hrs, TRX/USD pair has been trading in a sideways trend with intertwined moving averages the indicated lack of momentum in the market. TRX has dwindled by 1.7%, having moved from $0.02902 to the current price rate of $0.02761 over the last 24hrs.
The horizontal channels confirmed the sideways trend. In addition, the horizontal channels acted as the price of temporary resistance and support level. In which, they were defined at $0.02999 and $0.02746 respectively. TRX experienced a short-term dip to a low of $0.02761, followed by a short period of consolidation below the support level $0.02746.
Presence of a bullish accumulating pattern was later seen repeatedly that fluctuated the price momentum up to a high of $0.03013. This was followed by a slight dip that placed TRX to the current price of $0.02895. The RSI indicator X was also seen heading south that showed reduced reliance in the coin, thus increase sellouts.
Forecast
At the moment, the 7-day MA is gravitating above the 21 day MA which signals incoming bullish momentum. New targets should be set at $0.030.
Stellar (XLM/USD)
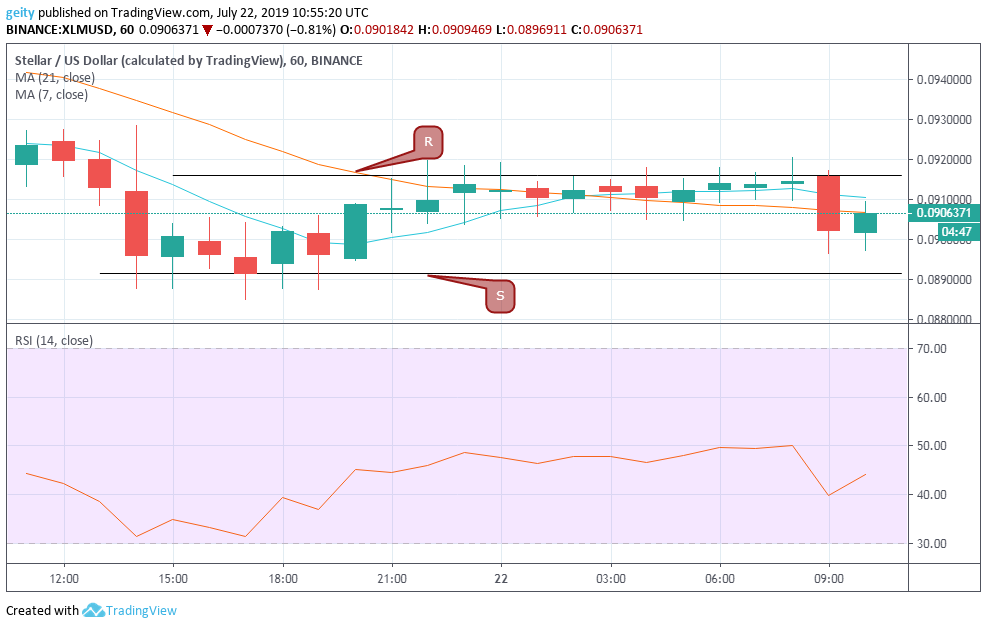
XLM/USD, on the other hand, has also dipped by 1.8% having begun the sell-off at $0.09234 and is currently trading at $0.09064. XLM saw a short-term dip that dropped to a low of $0.08875 that later consolidated below the support level $0.08915.
The pair’s price, later on, gained momentum to a high of $0.09198 above the resistance level $0.09159 before it embarked to a steady flow. Notably, both the significance level (resistance and support) were tested severally.
From 21:00 to 08:00, the RSI indicator was seen trading flat between level 40 and 60 that signaled a lack of momentum in the market. Additionally, the RSI is currently heading Northway that showed the unwillingness of traders to go short in anticipation for better currency value, thus increase buyouts.
Forecast
XLM is likely to go bullish in the coming hours as reflected by the 7 day MA that is currently gravitating above the 21-day MA. This indicates further upward rally. According to analysts, XLM could reach a high of $0.120 in the coming month. New targets should be set at $0.09300.


