
 Price Analysis Can The Bulls Break Out Of $0.2")
XLM/USD Price Medium-term Trend: Bearish
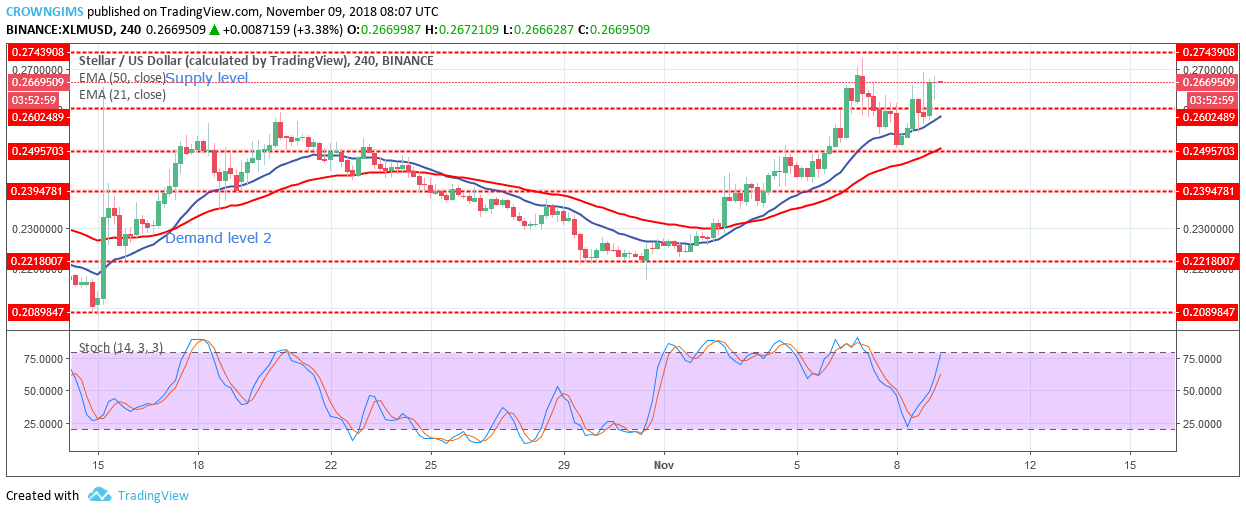
Supply levels: $0.27, $0.29, $0.32
Demand level: $0.26, $0.24, $0.23
XLM is bullish on the 4-Hour chart. The demand level of $0.22 was the low of the Stellar market on October 31. The bearish engulfing bar formed on that day at the same level indicates the presence of bulls with their pressure in the Stellar market. The takeover of the bulls was confirmed by the formation of bullish candles that broke the former supply levels of $0.23, $0.24, $0.26 and moved towards the supply level of %0.27.
The coin is trading on the 21-day EMA and the 50-day EMA. The 21-day EMA has crossed the 50-day EMA to the north side; this indicates uptrend movement is ongoing and the bulls are in control of the market. The Stochastic Oscillator period 14 is above 50 levels with signal lines pointing to the north which indicate strong buying signal.

Should the bulls increase or maintain their momentum the stellar price will continue increasing towards the supply level of $0.27 and may break it open to the upside and target $0.29 supply level.
XLM/USD Price short-term Trend: Bullish
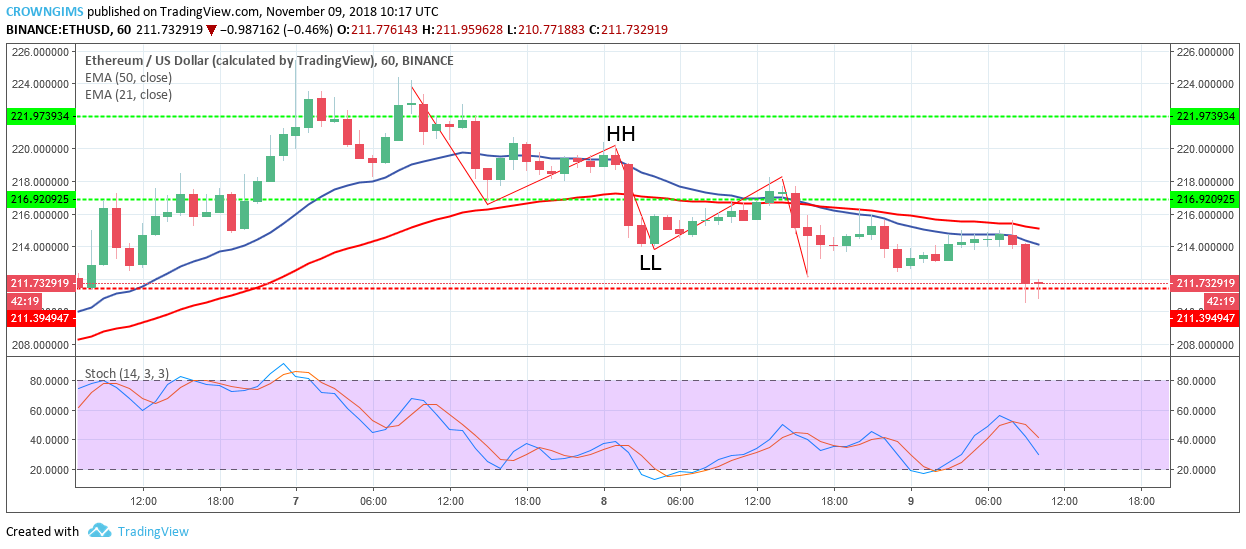
Stellar is on bullish trend on 1-Hour chart. XLM has been trending upwardly since November 1st, as the bulls gained pressure and pushed the XLM price up, broke up through former supply levels of $0.23, $0.24, $0.26 and increases toward supply level of $0.27.
Today, the price is above the demand level of $0.26 and also above 21-day EMA and 50-day EMA which connotes uptrend is ongoing. The Stochastic Oscillator period 14 is at 75 levels with its signal line point to the north indicate buy signal.


