
 Price Analysis_ The Bears Might take the Price Below $0.43")
XRP/USD Medium-term Trend: Ranging
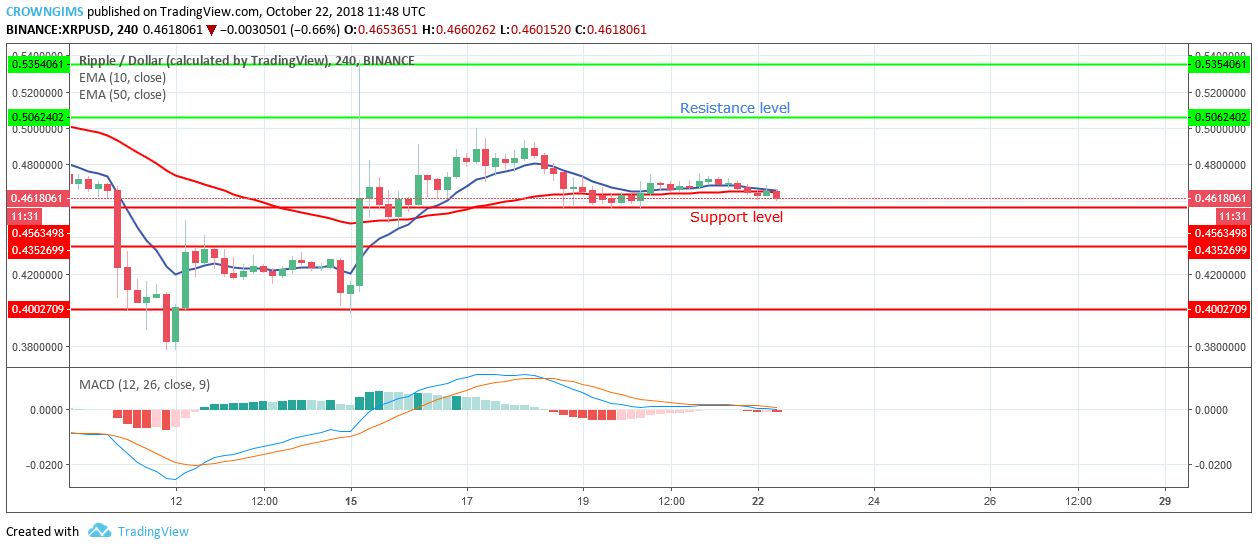
Resistance Levels: $0.50, $0.53, $ 0.57
Support Levels: $0.45, $0.43, $0.40
XRP/USD is ranging in its medium-term outlook. On October 16 the cryptocurrency formed bullish hammer candle that propelled the XRP to the north towards the resistance level of $0.50 but unable to break out before the bears moved with their high momentum and return the XRP price to the low support level of $0.45 where it started consolidating.
The coin is trading above the support level of $0.45 with the 10-day EMA and 50-day EMA interlocked with each other and the coin is on the two EMAs which indicate that the consolidation is ongoing. The MACD indicator with its histogram is on the zero line and its signal lines parallel on the zero level which confirms that consolidation is ongoing.
Should the bears increase their momentum and push the price to the south and break the support level of $0.45, the price will be exposed to the support level of $0.43. In case the support level of $0.45 holds the bulls may take over the market by increasing the price of XRP to the north towards the resistance level of $0.50
XRP/USD Short-term Trend: Bearish
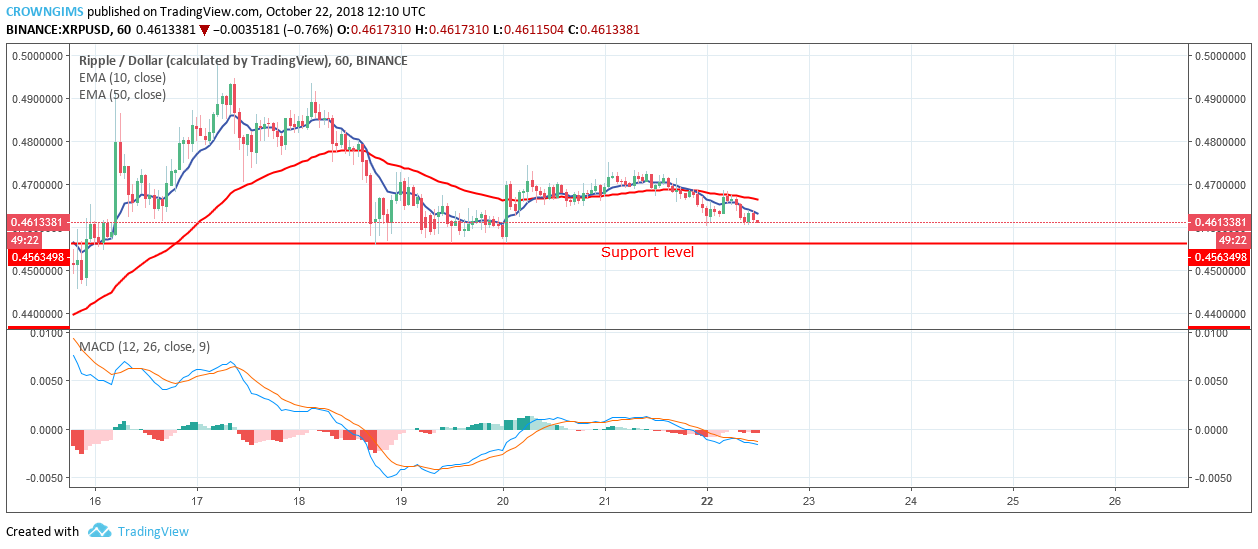
XRP is bearish on the short term. The coin was bearish yesterday as more bearish candles were formed. Today, XRP price is falling gradually on the 1-Hour chart and more bearish candles are forming which indicates the momentum of the bears. In case the bears were able to break the support level of $0.45, XRP will find its low at the lower support level of $0.43.
On the 1–hour chart the 10-day EMA has crossed the 50-day EMA downside and the price is below the 10-day EMA which indicates that price is falling. Moreover, the MACD histogram is below the zero line and the signal lines are pointing to the south which indicates a sell signal.


