

Distribution Territories: $0.013, $0.015, $0.017
Accumulation Territories: $0.013, $0.012 $0.011
TRX/USD Medium-term Trend: Bearish
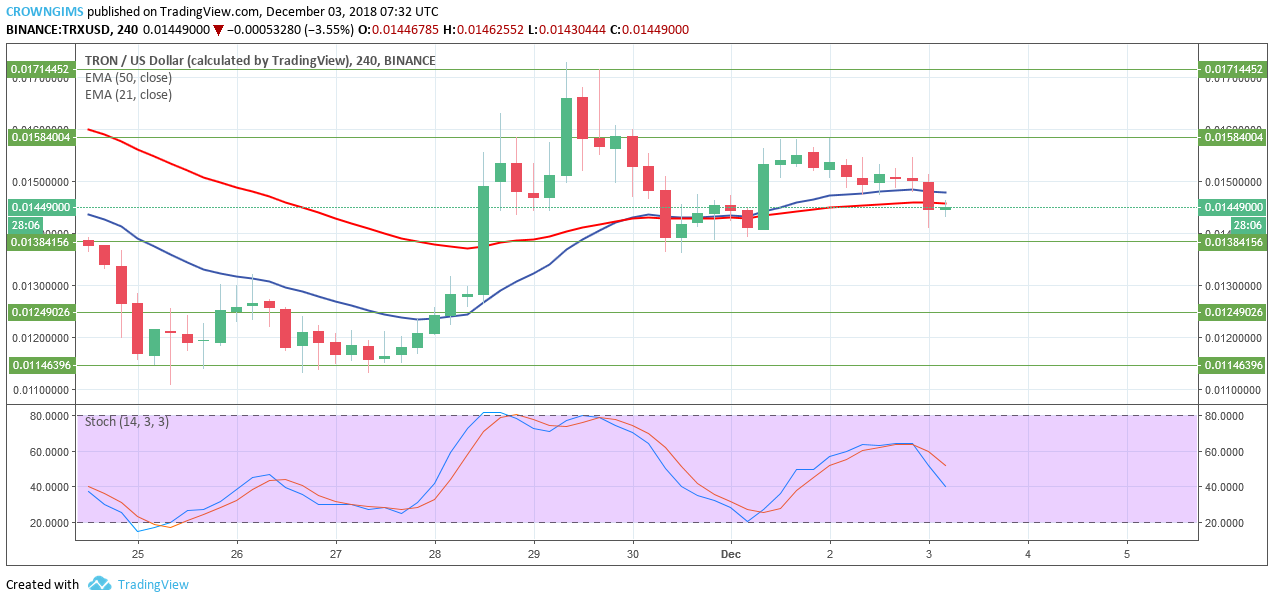
Ranging movement in the TRX/USD market on the 4-Hour chart; the coin rallied to the accumulation territory of $0.017 on November 26, where the further increase was rejected by the bears and the TRX declined towards the $0.015 price level. Inverted pin bar candle was formed as a sign of the bears’ pressure that led the price to the $0.013 price level but could not break out below the level and then, TRX price started ranging between $0.015 and $0.013 price levels.
The 21-day EMA and 50-day EMA were very closed and interlocked with each other and TRX price is between them indicating that consolidation is ongoing. However the Stochastic Oscillator period 14 is above 40 levels with signal lines bending down which indicates sell signal. Bullish price rally may be anticipated in case there is a clear breach above $0.015 price level with a strong bullish candle. A break out below the $0.013 will expose TRX to the low of $0.012 – $0.011 price level.

TRX/USD Short-term Trend: Bearish
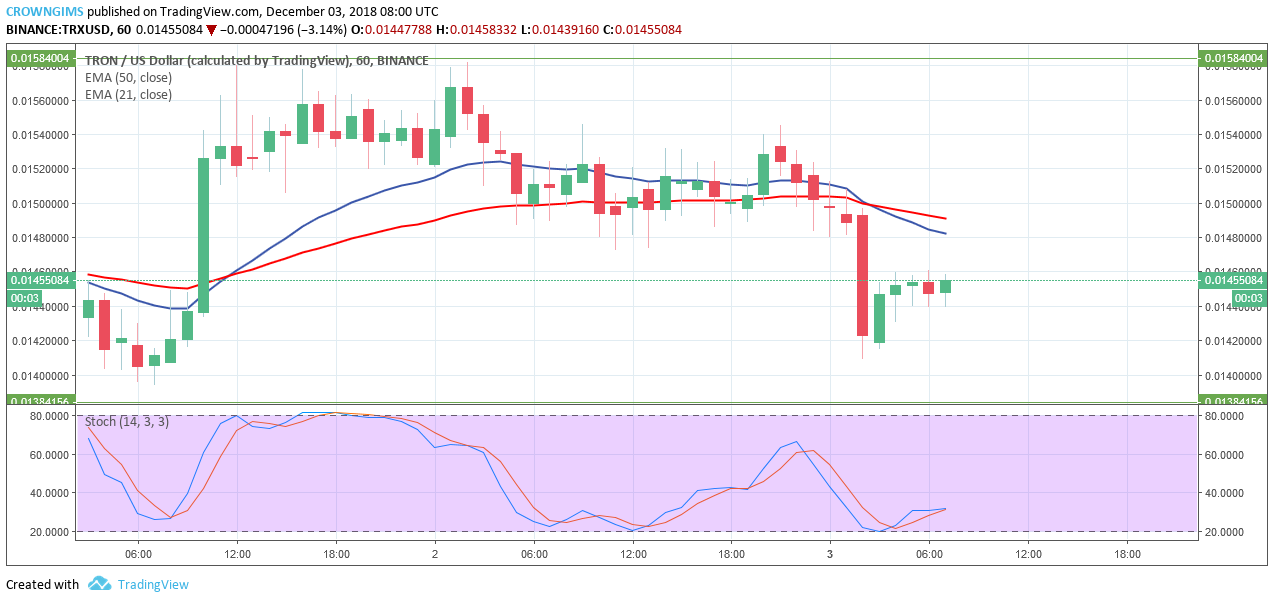
TRX is bearish on the 4-hour chart. TRX price was consolidating yesterday in between the two EMAs with 21-day EMA above 50-day EMA. A strong bearish candle formed today pushed the coin towards $0.013 below the two EMAs and the21-day EMA crossed the 50-day EMA downside which is the sign of bears’ pressure that may lead to further downtrend.
The coin pulled back to retest the broken level but currently consolidating with the Stochastic Oscillator period 14 at the level above 30 and the signal lines closed indicating that consolidation is ongoing. Traders should be patience.

