

Distribution Territories: $0.023, $0.025, $0.027
Accumulation Territories: $0.021, $0.019, $0.017
TRX/USD Medium-term Trend: Bullish
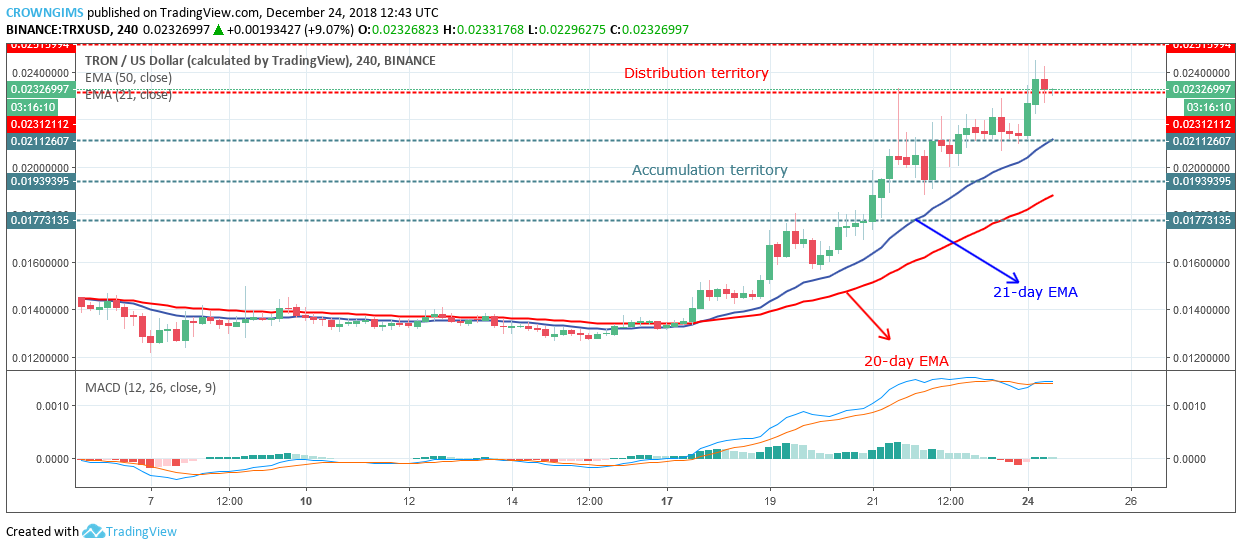

The cryptocurrency remains bullish on the 4-Hour chart. The coin has been making higher highs on the medium-term outlook since December 17 when the coin broke out from the consolidation which lasted for more than six trading days. There was a pullback on December 19 at $0.017 former distribution territory.
The price bounced at the 21-day EMA and the price resumed its uptrend, rallied to the upper distribution territory of $0.023 where it encountered the bearish force that pushed the coin down below the $0.021 price level with the candle formed inverted pin bar on December 21, short hours consolidation took place and the bullish pressure placed the coin above the distribution territory of $0.023.
The crypto is still under the bullish pressure as the 50-day EMA remains below the 21-day EMA and the coin trading above the two EMAs which connotes strong bullish trend is ongoing. The moving average convergence divergence (MACD) period 12 with its histogram above the zero levels and the signal lines above the histogram point upside indicate a high probability of bullish trend continuation. Traders should not underrate the inevitability of pullback on the bullish trend.
TRX/USD Short-term Trend: Bullish
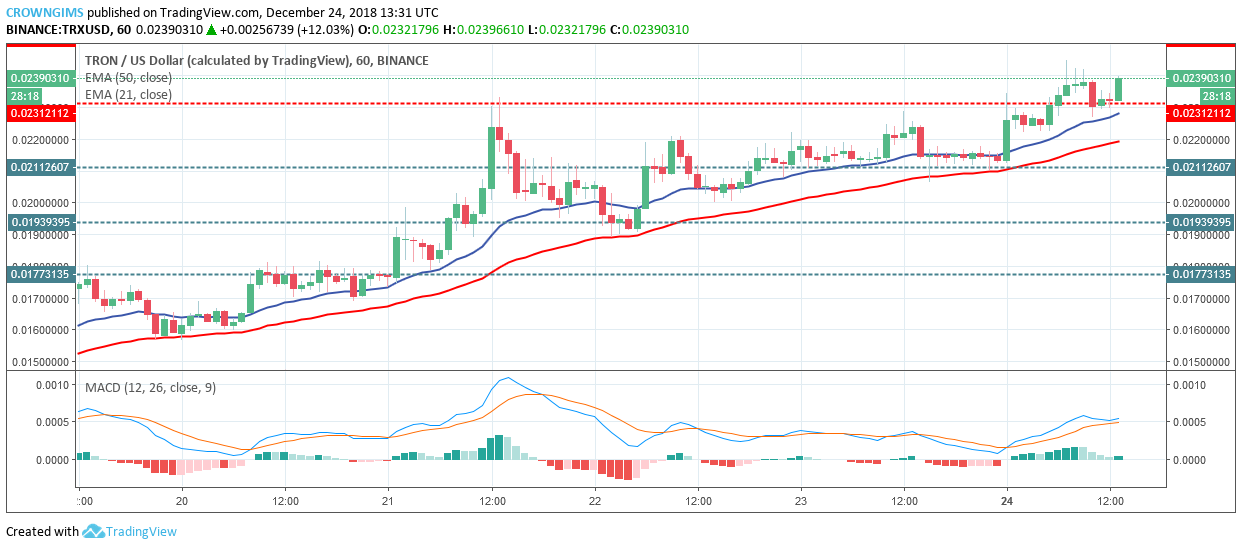
TRX price is currently above the $0.023 price level with the formation of the hourly bullish candle above the two EMAs separated from each other implies that there is a probability of uptrend continuation.

