
, Binance Coin (BNB), and IOTA Price Analysis and Forecast")
Bitcoin (BTC/USD)

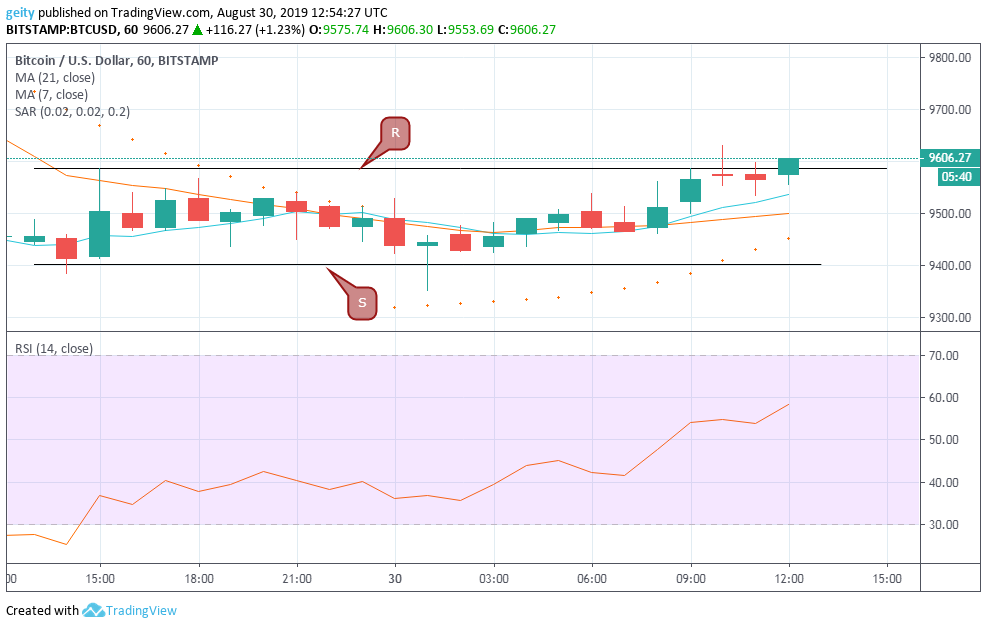
On an intraday chart, the price of BTC/USD pair is trading on a downside trend below $10,000 level. However, despite the dip, the pair’s price has been showing a slight improvement having escalated from $9456.70 to $9606.27, which is a 1.6% increase.
BTC/USD pair has also exhibited a bullish break near $9586.73 (R) and $9402.57 (S). The moving averages have also turned from a bearish sign to a bullish sign. The bulls seemed to be struggling to break past $9600.00 that give investors hope to go long. Additionally, the RSI indicator has drastically recovered, climbing from the oversold region and is now above level 50 that indicate a bullish outlook.
Forecast
The market is likely to foresee an incoming bullish momentum since the parabolic SAR is currently below the candles, which gives a buy signal. Besides, an upward correction is expected, if the pair’s price could break above the $9600.00 level with a new resistance level anticipated near $9800.00.
Ripple (XRP/USD)
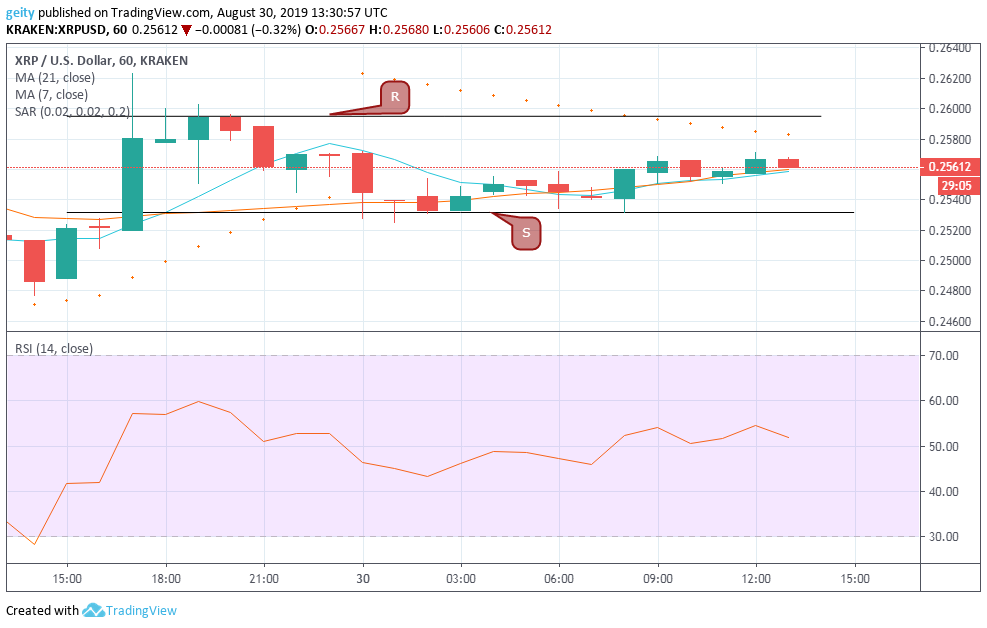
Ripple’s XRP, on the other hand, had begun to record a bullish performance starting yesterday at 15:00 where buyers pushed the price up to rally at a high of $0.25195.
Unfortunately, the bullish struggle to break past $0.25955 resistance level was not successful. A steep decline later followed that took a break below the 0.25317 support level for some time before regaining strength to trade at $0.25612. The RSI indicator also signaled a bullish outlook since it is seen above 50.
Forecast
The parabolic SAR is trading above the candles that signal a bearish sign. A downside correction near $0.24000 is likely that is if the price doesn’t break past $0.25 in the next few hours.
Litecoin (LTC/USD)
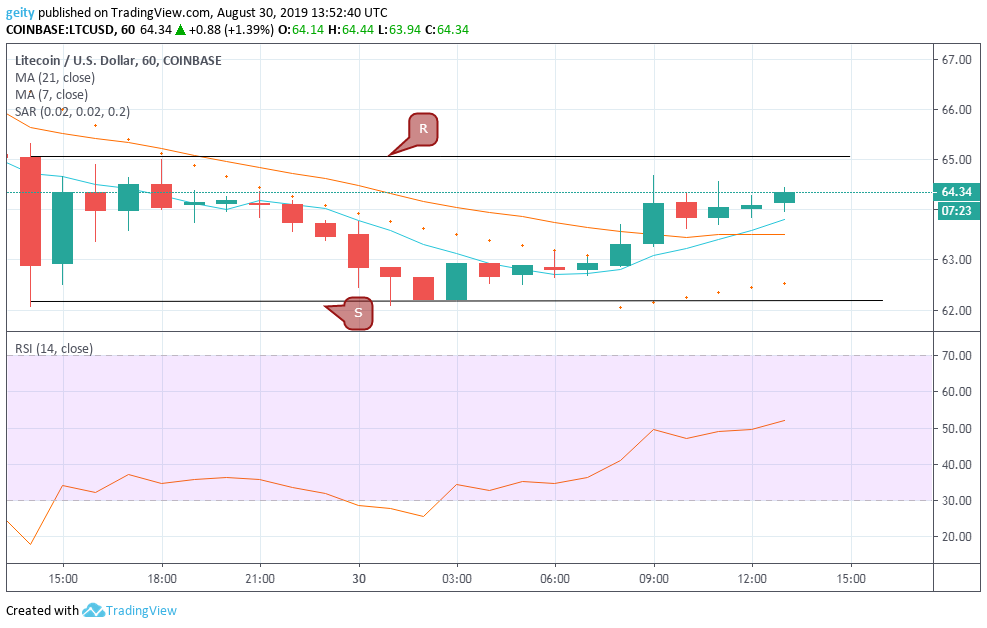
LTC/USD pair consolidated between $64.03 and $62.15 throughout the intraday. However, the pair’s price first saw a sharp dip to a low $62.05 before recovering to the current price of $64.34. The moving averages generally indicated the bearish sign over the last 24hrs.
The RSI indicator is also heading north, indicating the bulls are dominating the momentum. A continuous bullish momentum is anticipated since the short- term SMA has crossed above the long- term SMA. Investor’s sentiments have increased since they are hoping for positive results in the near term.
Forecast
Investors should get ready to go long since most indicators signal a buy sign with the parabolic SAR currently seen above the candles. A break above $65.00 may result in an upside correction near $69.00.
Disclaimer: The views and opinions expressed here are solely those of the author and do not necessarily reflect the views of ZyCrypto. None of the information you read on ZyCrypto.com should be regarded as investment advice. Every investment and trading move involves risk, you should always conduct your own research before making any investment decision.


