
 Technical Analysis #2 - Litecoin trading in steep declining wedge")
Litecoin has continued to decline further over the past week, losing 15.83% in the past 7 trading days alone. The cryptocurrency is currently trading at $64.11 after gaining a small price hike totalling 1.15% over the past 24 hours.
News was relatively light this week regarding Litecoin. Cryptomonsters launched this week allowing users to create and trade cute crypto monsters that is run on the Litecoin blockchain.
Coinbase have also announced that they have released a plugin tool that will make it easier for merchants to accept cryptocurrencies online. This plugin is intended for woocommerce users and is already available on GitHub. Litecoin is one of the few selection of coins that Coinbase allows to trade so therefore it will greatly benefit from this plugin.
Litecoin is currently ranked in 7th position in terms of overall market cap across the entire industry. It has a total market cap value of $3.7 billion and has lost a total of 16% over the past 30 trading days.
Let us continue to analyse price action for LTC over the long term.
Price Analysis
LTC/USD – LONG TERM – DAILY CHART
https://www.tradingview.com/x/YwUcoWPb/
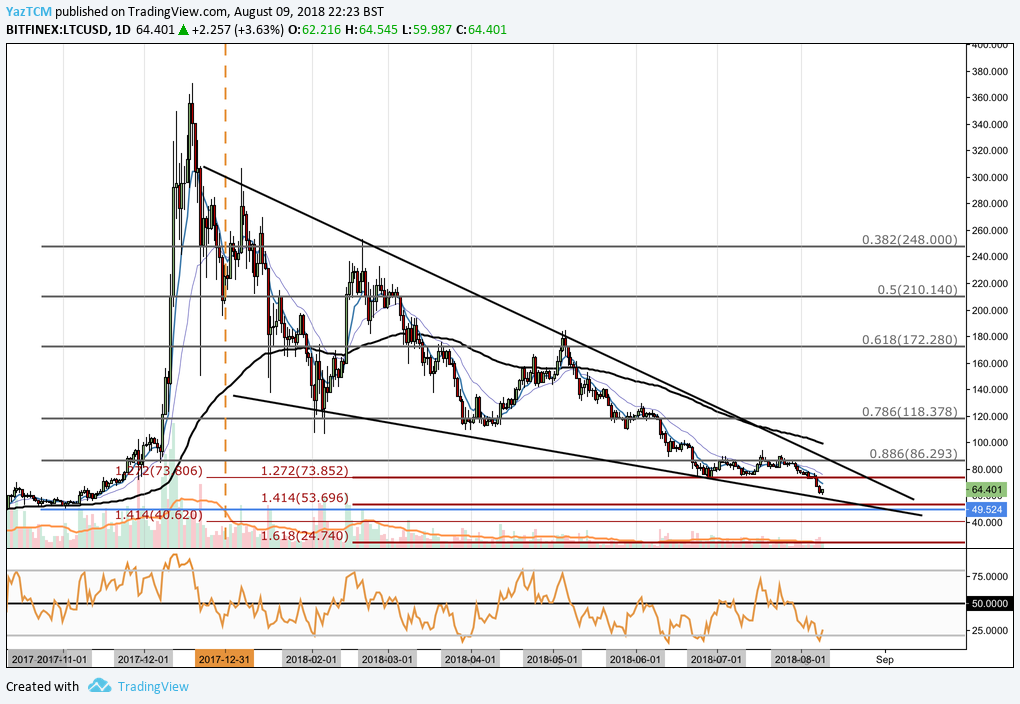
Analysing price action over the long term perspective above, we can see that LTC had experienced a bullish price run when price action started from a low of $49 on November 2nd 2017 and extended to an all time high priced at $370 on December 19th 2017. This price run totalled a 700% increase in price from low to high.
After placing the all time high, price action proceeded to roll over, initially finding support at the .618 Fibonacci Retracement priced at $172, during January 2018. This Fibonacci Retracement is measured from the entire bullish run aforementioned.
The market continued to drop through February until the market found support at the .786 Fibonacci Retracement level priced at $118. We can see that the market managed to stay above this price level for the next 3 months until it broke below and fell through this level during June 2018.
We can see that in June price action found some support at a downside 1.272 Fibonacci Extension level priced at $73.84 .This price level provided some significant support until the market managed to break below this in August 2018.
We can also see that over the course of the trading year, price action has formed a very steep declining wedge pattern and is very swiftly approaching the apex of the triangle.
If the bearish pressure continues within the market, we expect the nearest level of support to be located at the short term downside 1.414 Fibonacci Extension level priced at $53.69. We expect this price level of support to be significantly bolstered by the lower boundary of the falling wedge.
Alternatively, if the bulls can re-enter the market, we expect immediate resistance to be expected at the downside 1.272 Fibonacci Extension level once again, priced at
$73.85. Resistance above this level is located at the long term .886 Fibonacci Retracement level priced at $86.29.
The technical indicators within the market are currently heavily favouring the bears at this moment in time. The RSI technical momentum indicator is currently trading at extreme oversold conditions below the 20 handle.
For a signal that the bearish momentum may be beginning to lose momentum, we will look for the RSI to make its way toward the 50 handle. A break above 50 would indicate that the bulls are starting to gain control within the market again.
Similarly, the moving average indicators are all presenting bearish conditions. The shorter term moving averages are trading below the longer term moving averages and all three of them are pointing in a bearish direction.
The first sign that teh bearish pressure may be fading will be indicated when the 7 day EMA (blue line) turns towards and crosses above the 21 day EMA (purple line). As they cross over one another this creates a bullish crossover signal indicating that the bulls are beginning to take control.

