

IOTA/USD
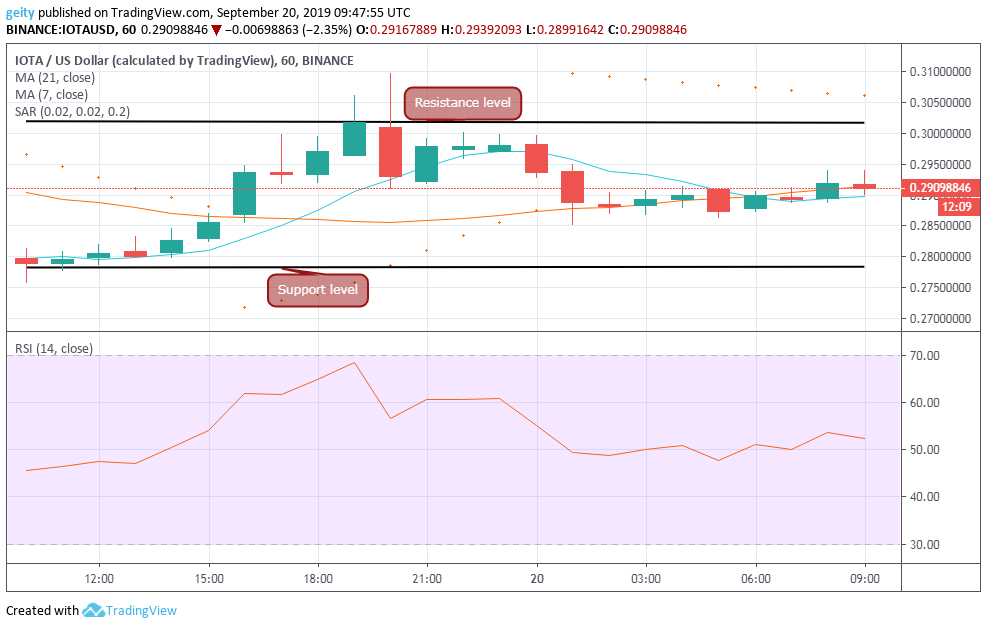
On the intraday chart, the price of the famous cryptocurrency has marked an upside gain of 4.1%. Afterward, the coin opened the day trading at $0.2789 and is now wrapping at $0.2909.
However, IOTA/USD pair first exhibited a bullish move that pushed that price up to rally near a high of $0.3097. It later took a short-term consolidation phase below $0.3018 significant resistance level.
A slight dip to a low of $0.2850 was later on seen before the pair’s price embarked to a steady flow below $0.2868 level that defined the current price at $0.2909.
Despite, the gain, the market trend of IOTA was sideways, as reflected by the intertwined moving averages. Notably, the parabolic SAR is now above the candles that signify a sell signal.
Additionally, the moving averages are currently flattish, and the RSI is hovering between the midpoints that suggest a range-bound in the near term that might be followed by a strong breakout.
Outlook
If sellers manage to break the price below $0.2783 support level, a downside correction near $0.2500 may be encountered. Conversely, an upside move beyond $0.3018 resistance level may hit further upward rally near $0.4000.
Tron (TRX/USD)
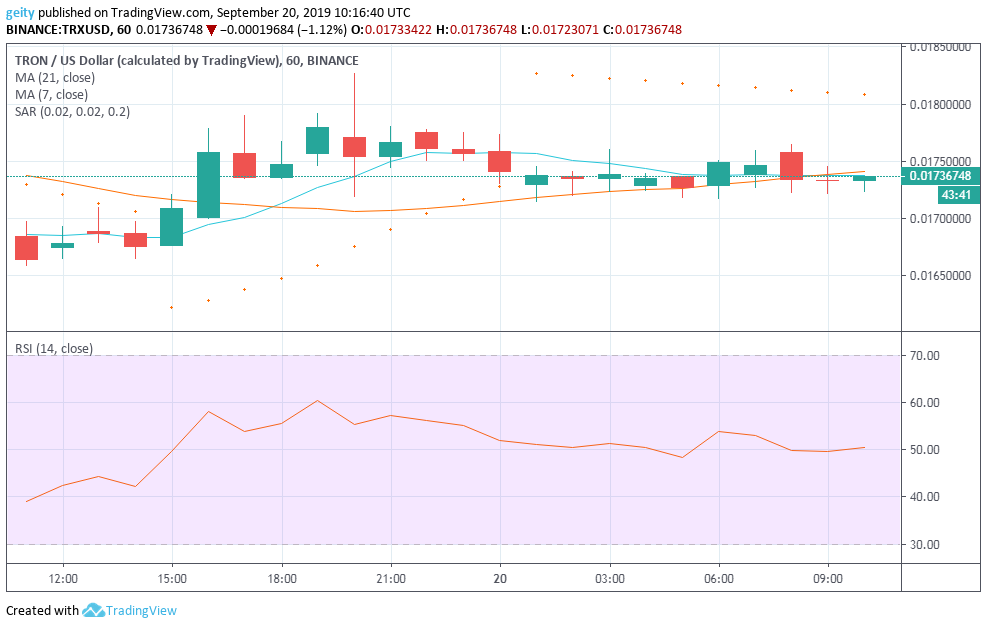
TRX/USD has also outperformed, having given an intraday gain of 4.5%. TRX moved from the opening value at $0.0166 and is now changing hands at $0.0174.
However, the upside correction was seen at the beginning of the session that was followed by an upside price fluctuation to a high of $0.0183 at around 20:00. Nevertheless, rejection of higher prices was seen that led to a sideways movement below $0.01700 for the rest of the day.
The RSI was seen hovering between midpoints that indicated indecisive market condition, which also foresee consolidation phase below $0.01700 level for a short-term. However, the parabolic SAR is now above the candles that suggests a short position for investors.
Outlook
If the bear run strengthens up, then a break below $0.0170 is likely, as it could result to a further downside rally near $0.01650.
Tezos (XTZ/USD)
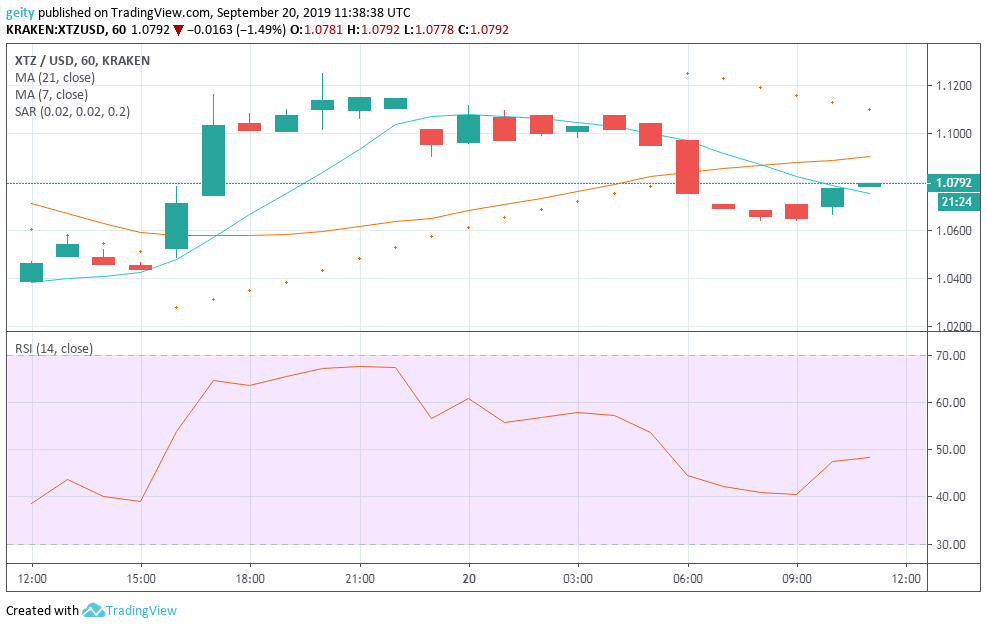
XTZ/USD pair was trading yesterday at $1.0461, but today it has gone up by a margin of 3.06% in the last 24hrs.
The upward move showed an increase in buyouts due to strong buying pressure. Besides, an upside correction to a high of $1.1123 as from 12:00 to 20:00 was seen. That later took a break for a short-term period of consolidation below $1.0952 level. The pair’s price later dropped slightly to trade below $1.064 that defined the current price at $1.0792. The fact that the price dropped from $1.0952 to $1.064 showed that the bullish action is being overcome by the bearish nature.
Looking at the technical indicators, the parabolic SAR is above the candles, and the long-term SMA has crossed above the short-term SMA. Also, the RSI is currently below average, that is a negative sign as it suggests incoming bearish outlook.
Disclaimer: The views and opinions expressed here are solely those of the author and do not necessarily reflect the views of ZyCrypto. None of the information you read on ZyCrypto.com should be regarded as investment advice. Every investment and trading move involves risk, you should always conduct your own research before making any investment decision.


