

IOTA has seen been relatively stagnant over the past 24 hours of trading as the market places a dojo candle signalling that both the bulls and the bears are battling for control. The cryptocurrency is presently changing hands at a price around $0.49 on exchanges after seeing a small price decline totalling 4% over the pat 7 trading days.
The cryptocurrency is unique in the sense that is not built upon the blockchain art hate true like the majority of its counterparts. Instead it uses a new distributed consensus mechanism known as Tangle which leverages every user to verify each other’s transactions.
The cryptocurrency has achieved many impressive milestones such as creating a fully operating charging network for electric vehicles in the Netherlands in association with Elaad.
The cryptocurrency is currently ranked in 12th position in terms of overall market cap across the entire industry. It currently holds a total market cap value of $1.37 billion after suffering an 11% price decline over the past 30 trading days.
The 15 month old cryptocurrency has suffered a further 51% precipitous price decline over the past 90 trading days and is currently trading at a value that is 90% lower than its all time high price.
Let us analyse price action over the short term perspective and highlight any potential support and resistance areas moving forward.
Price Analysis
IOTA/USD – SHORT TERM – DAILY CHART
https://www.tradingview.com/x/kJ99lJAb/
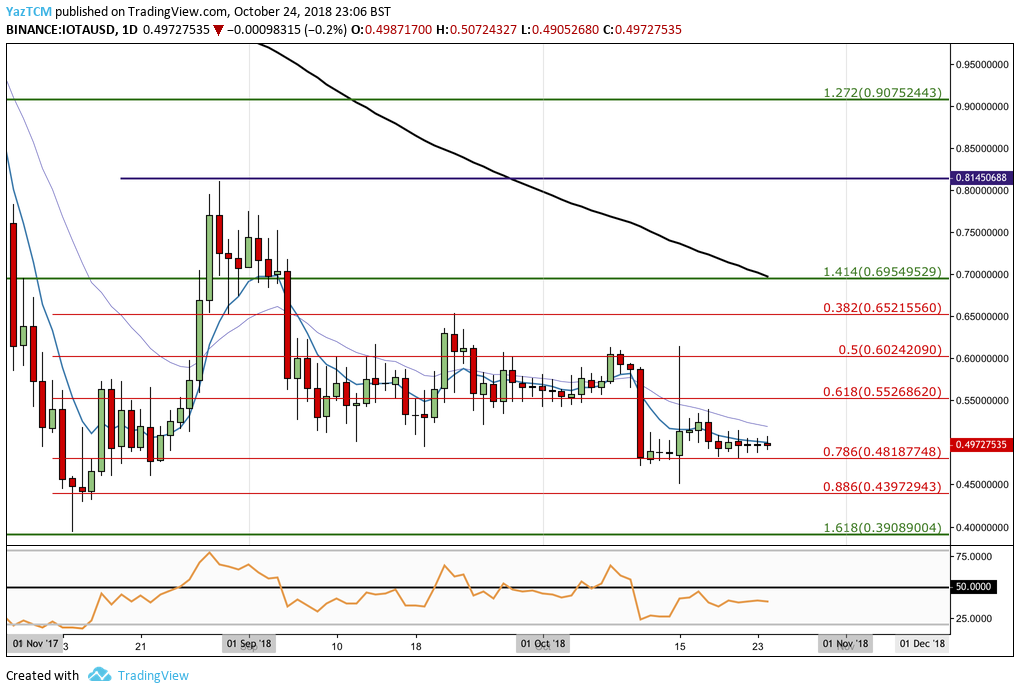
Analysing price action from the short term perspective above we can see that the market had reached a major level of support during August 2018 when price action reached the downside 1.618 Fibonacci Extension level priced at $0.3908. As price action approached this level the bears ceased with their pressure and the bulls stepped in.
We can see that the market reversed from this support level and surged from a low of $0.3940 on the 14th of August 2018 to a high of $0.8109 on the 29th of August 2018. This was a 100% price increase from low to high.
We can see that after placing the high, the market rolled over and started to decline. It continued to fall until finding relative support at the psychological $0.50 handle during September 2018. The bulls were defending the area aggressively determined not to let the bears push price action below the $0.50 handle.
However, during October 2018, the bulls defence was breached and the bears pushed price action further lower to find support at a the .786 Fibonacci Retracement level priced at $0.4818. This price level has proven to be a critical support area.
Moving forward, if the bears pressure price action below the support at $0.4818 we can expect immediate support beneath at the .886 Fibonacci Retracement level priced at $0.4397. If the successfully manage to push price action even lower then we can expect further support beneath at the previous downside 1.618 FIbonacci Extension level priced at $0.3908.
On the other hand, if the bulls manage to regroup and push price action higher they will encounter immediate resistance higher at the .618 Fibonacci Retracement level priced at $0.5526. If they continue to press market action above this resistance then higher resistance above can be expected at the .5 and .382 Fibonacci Retracement levels priced at $0.6024 and $0.6521, respectively.
If the bulls continue on their conquest higher they will meet serious resistance at the previous 1.414 Fibonacci Extension level priced at $0.6954. The 100 day moving average is also trading within this resistance level further adding to the expected resistance here.
For a bullish trend to become established, the bulls would have to penetrate above the $0.8145 handle before begin able to move forward and test the $1.00 mark.


