
![Ethereum [ETH] Price Analysis | November 9, 2018](https://zycrypto.com/wp-content/uploads/2018/11/Ethereum-ETH-Price-Analysis-November-9-2018.png "Ethereum [ETH] Price Analysis November 9, 2018")
Supply zones: $216, $218, $207
Demand zones: $211, $221, $226
ETH/USD Medium-term Trend: Bearish
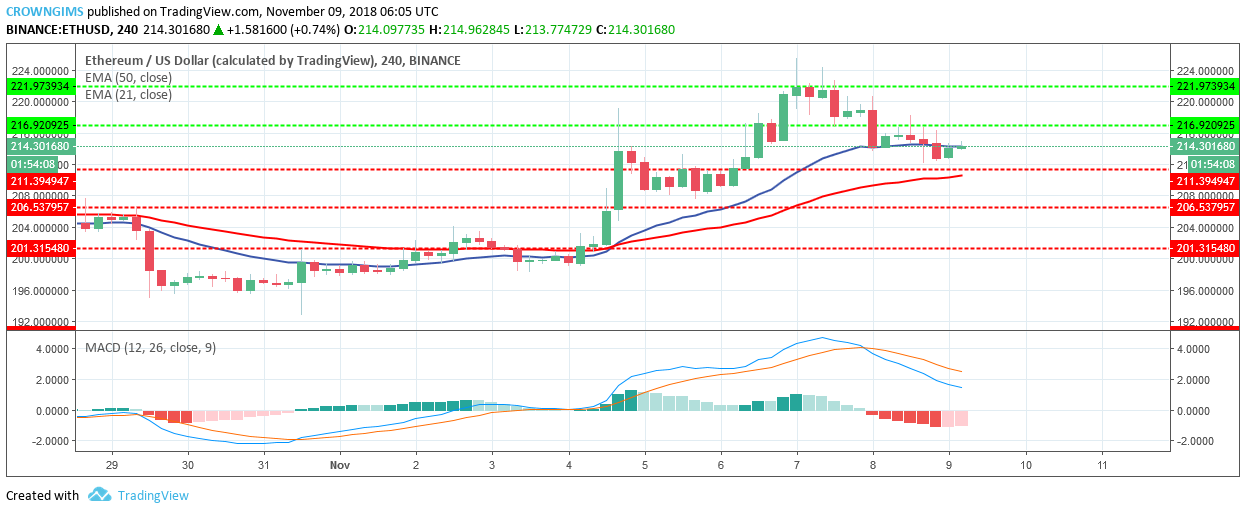
ETH/USD was bearish yesterday on medium-term outlook. The Bulls lost the pressure when it reached its high supply zone of $207 on October 7, the bears took over the market with the formation of bearish hammer at $221 supply zone which pushed the ETH price to the south, broke the demand zone of $216, and exposed the demand zone of $211.
ETH price is between 21-day EMA and 50-day EMA with 21-day EMA above the price which indicates that the ETH price is falling as the bears are increasing momentum. In addition, the MACD with its histogram is below zero level and its signal lines pointing to the south connotes sell signal.
In case the bears increase their momentum and break the demand zone of $211, ETH will be exposed to the demand zone of $206. Should the demand zone of $211 hold ETH will resume up trending movement.
ETH/USD Short-term Trend: Bearish
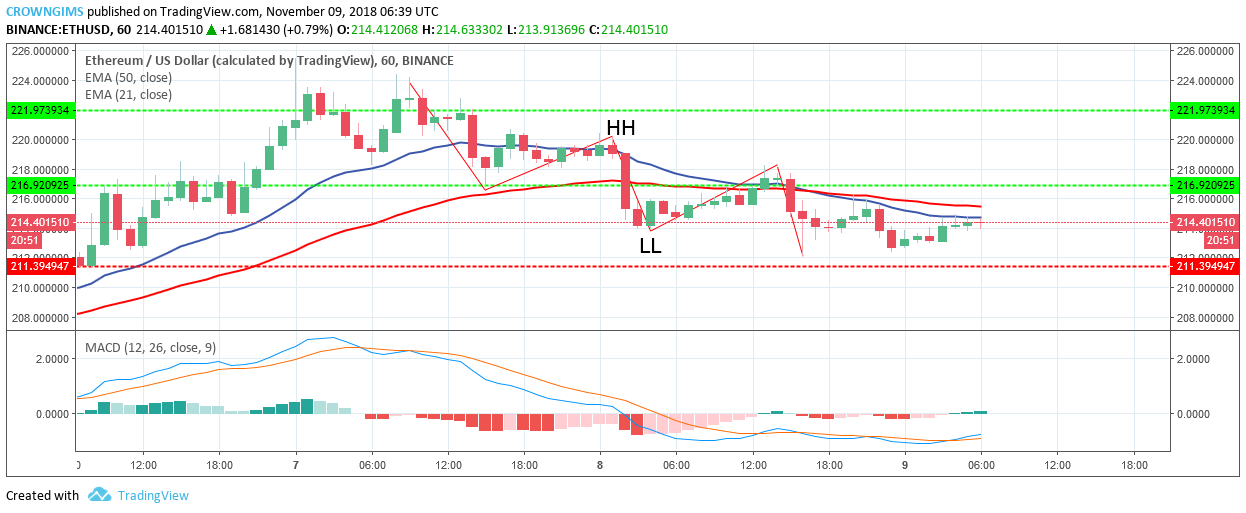
On 1-Hour chart ETH/USD is bearish. The coin continues its bearish movement which commenced on November 7, after the formation of doji candle at the supply zone of $221, The market has been making Lower Lows (LL) and Lower Highs (LH) pattern which characterizes downtrend movement.
The bears are in control of the market as the demand zone of $216 has been broken downside, exposing the demand zone of $211. The 21-day EMA crossed the 50-day EMA downside which indicates downtrend is ongoing. Moreover, ETH is below 21-day EMA and 50-day EMA which confirm downtrend movement.
, and Stellar (XLM) Price Analysis – Recovery Expected Above Major Support Levels")
 and Stellar (XLM) Weekly Price Performance Overview")
