

Eos has experienced a 0.69% increase in price over the past 24 hours of trading. The cryptocurrency is currently exchanging hands at $7.05 as the bulls desperately defend price action above $7. Eos has suffered a 3.35% drop over the past 7 trading days and 17.85% over the past 30 trading days.
Eos was designed to become a next generation blockchain which would provide scalability to an enterprise level. One of the biggest problems with blockchains today is an issue of scalability. Ethereum can only achieve 25 transactions per second, Bitcoin only 7. Eos has recently created its new all time high TPS rate clocking in 3708 TPS recently.
This helps Eos to secure its position as the most powerful infrastructure for decentralised applications. The vertical and horizontal scaling along with its parallel processing makes this an exciting project to see how far it can grow.
Recently, Dan Larmier, founder of Eos, has suggested a proposal for users to be able to rent out their unused Eos bandwidth and processing power. This would require users to lock up and stake their coins for periods of up to 30 days in order for them to be rented out to others so developers can use the spare resources. This would create a passive income for the Eos holders and also helps developers to keep costs low.
Eos is currently ranked at 5th position in terms of overall market cap across the entire industry, with a total market cap value of $6.38 billion. Eos has some significant losses it needs to regain considering that the cryptocurrency has lost 60.99% over the past 90 trading days.
Let us continue to analyse price action over the short term for Eos.
Price Analysis
EOS/USD – SHORT TERM – DAILY CHART
https://www.tradingview.com/x/o5GxpDtv/
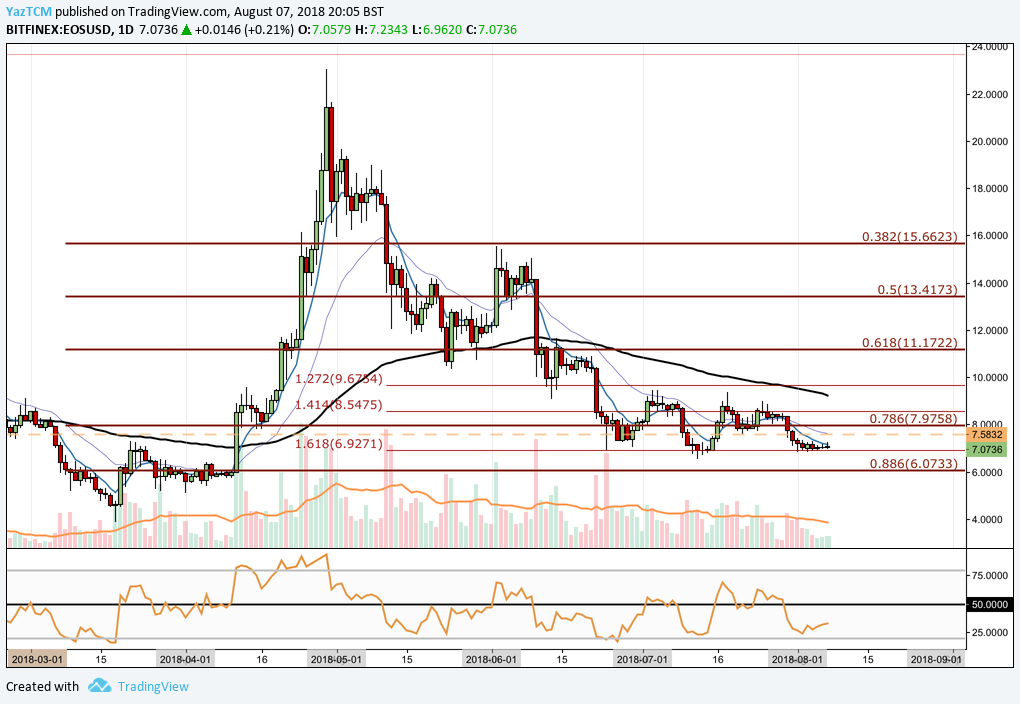
Analysing the market from the short term perspective above, we can see that Eos had experienced a price run totalling 500% during March/April. Price action started from a low of $3.87 on the 18th of March and extended to a high of $18.73 o the 29th of April.
Price action went on to roll over during June, finding support at the .618 Fibonacci Retracement priced at $11.17. This Fibonacci Retracement is measured from the bullish run outlined above. It is also important to highlight that this area of support was reinforced by the 100 day moving average which was hovering within the same price region.
The market continued to drop during July, originally finding support at a short term downside 1.272 Fibonacci Extension priced at $9.67. However, the bearish pressure was too powerful and price action continued to fall until it found support around the .786 Fibonacci Retracement priced at $7.97.
We can see that during July and the initial stages of August, the market has been heavily supported at the downside short term 1.618 Fibonacci Extension level priced at $6.92. This price level has provided significant support during June and is expected to hold the market during August. However, if the bears do manage to pressure the market below $6.92 we expect immediate support to be located at the .886 Fibonacci Retracement priced at $6.07.
Alternatively, if the bulls can gather pressure at this support level and begin another price rally, we expect immediate near term resistance to be located at the .786 Fibonacci Retracement priced at $7.97. Further resistance above this level is expected at the 1.414 Fibonacci Extension priced at $8.54 and then the 100 day moving average which is currently hovering around the $9.20 handle.
We can see that the technical indicators are heavily favouring the bears at this moment in time. The RSI is currently trading well below the 50 handle as it trades near oversold conditions.
If the RSI starts to approach the 50 handle we can assume that the bearish pressure within the market is showing signs that it is fading. A break of the RSI above the 50 handle would indicate that the bulls are really starting to gather momentum within the market.


