

EOS/USD
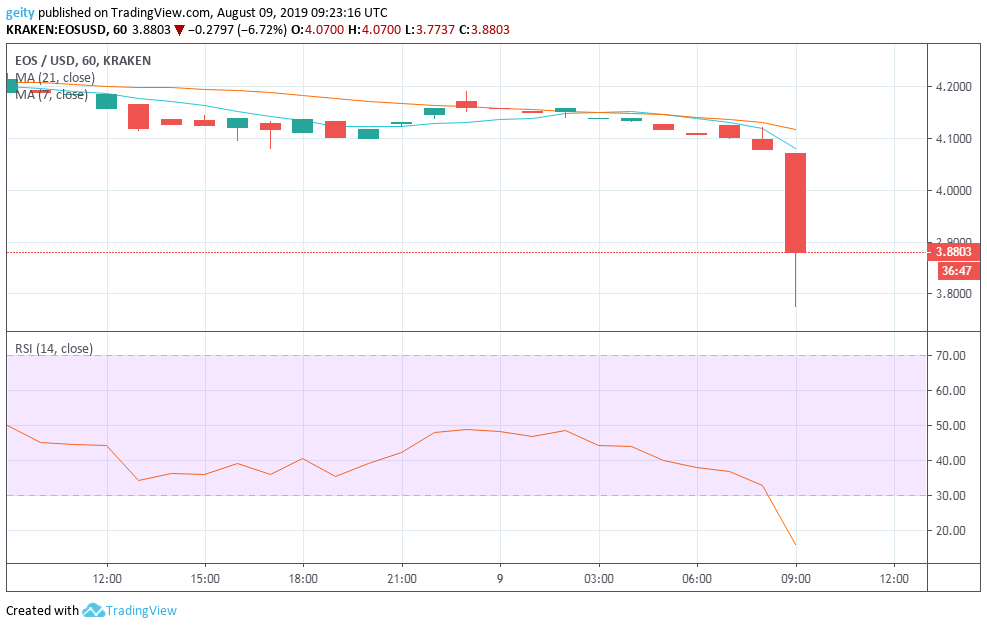
On an hourly chart, EOS/USD has underperformed with all the indicators indicating a bearish market rally. EOS was today ranked at 8, with an intraday loss of 7.3%. The circulating supply recorded was 926,692,712 coins and a market capitalization of $3.822 billion in the course of 24hrs.
The famous cryptocurrency started the session trading at $4.1869 that was followed by a long-term period of consolidation the consolidated near support level at $4.0976. A breakout was later seen that dipped the price to a low of $3.7737 before defining the current price at $3.8803.
The bearish pressure was buttressed by the moving averages where the 21 day MA was seen hovering above the 7 day MA. The relative strength index is currently below level 30 that indicated an oversold market momentum. This also showed that sellers are back on their action.

Forecast
A further bear market is to be expected as indicated by the RSI indicator that is currently heading north, and the 21 day MA that is currently above the 7 day MA. All these indicators designate a more bearish outlook. New targets should be set at $2.9000.
Ripple (XRP/USD)
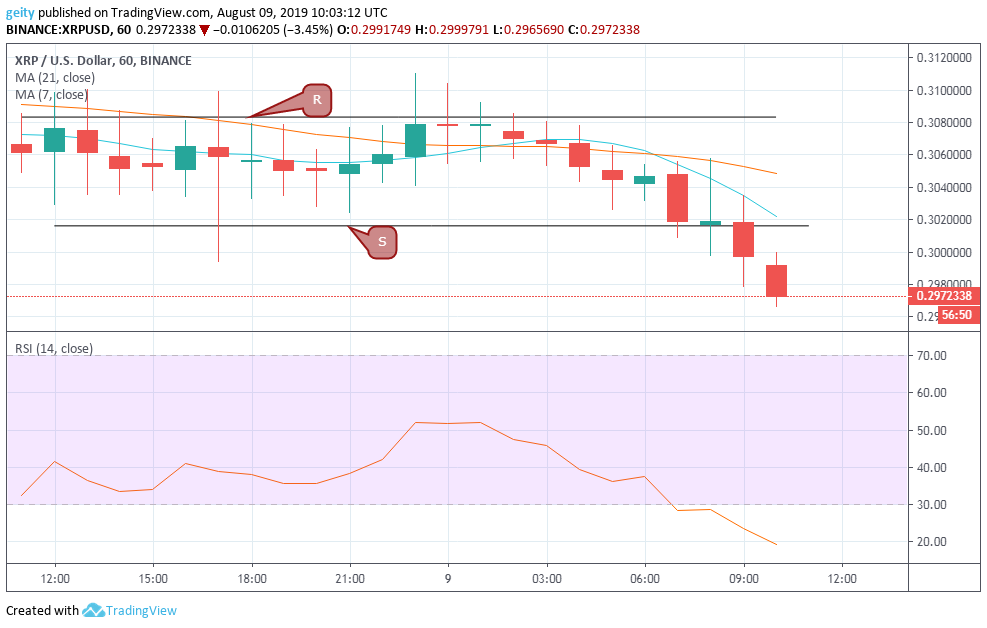
The struggle of XRP price continues since the bears seemed to have the upper hand. On an hourly chart, XRP market has exhibited a bearish outlook with the support level $0.30161 being broken. The downward move has dipped the price of XRP from $0.30614 to $0.29723 that translated to an intraday down surge of 2.9%.
Presence of a long-legged Doji was also seen at several times that indicated indecision about the future market direction. Notably, the resistance level was also defined at $0.30836.
The drop in the pair’s price has shown negative investors sentiments with the RSI indicator seen moving down from a high of 52 to currently trading below the oversold market territory (below level 30). This signals an increase in sellouts.
Forecast
A further downward move should be expected, with the 21 day MA above the 7 day MA and the RSI indicator trending south ways that motions a bearish outlook. New targets should be set at $0.28900.
Litecoin (LTC/USD)
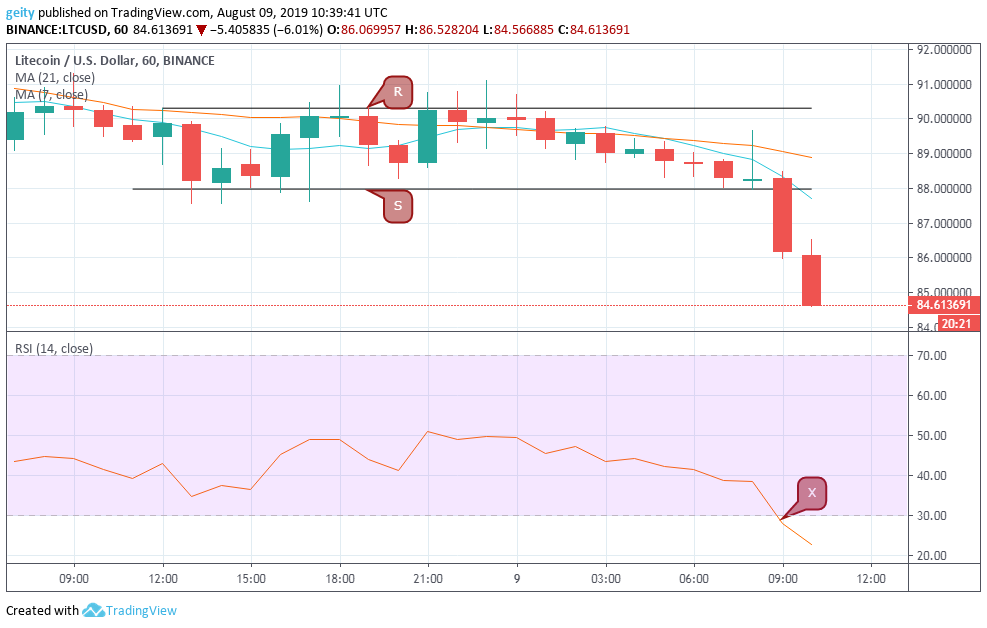
LTC/USD pair also had undergone a bearish outlook. It’s down by 6.17% having opened today’s trading at $90.1772 and is currently changing hands at $84.6137. The market consolidated loses between the resistance level $90.3195 and support level at $88.0002. That was followed by a breakout that breached the key support level.
The 21 day MA is currently above the 7 day MA indicating bearish momentum. The RSI indicator X is also trading below level 30 that showed LTC is trading on an oversold market territory. Increase in sell-offs has been encountered throughout the intraday that pushed the market capitalization of LTC to $5.4 billion.
Forecast
All the indicators are at the moment, pointing at the further downward move. The RSI indicator is heading north, and the 21 day MA is above the 7 day MA that signals a bearish sign. New target should be set at $83.00.


