
 and Stellar (XLM) Weekly Price Performance Analysis")
Stellar (XLM/USD)
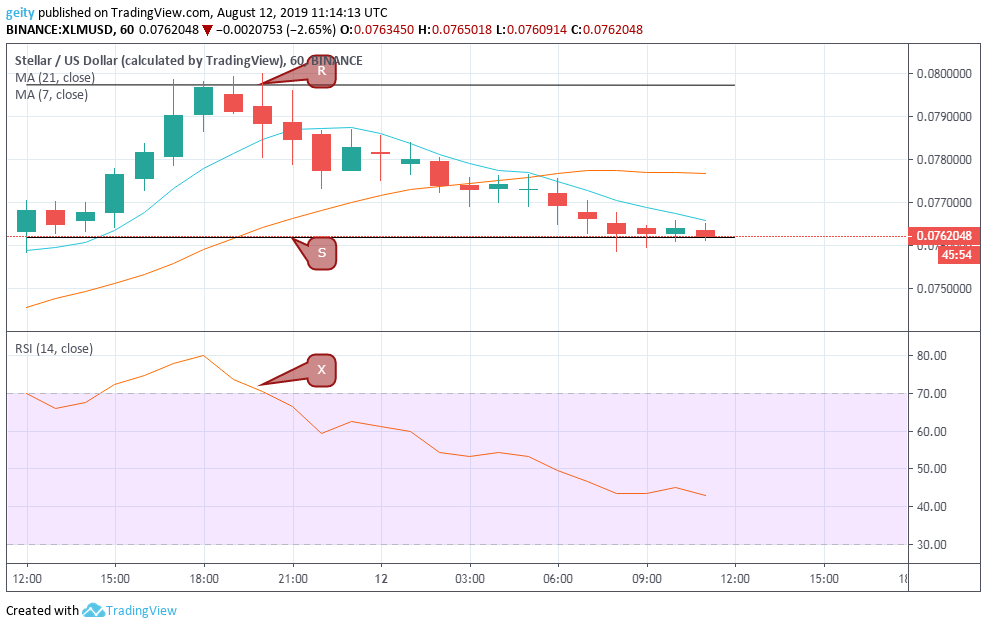
On an hourly chart, XLM/USD pair has been fluctuating with a bearish nature. XLM is down by 3.4%, having moved from $0.0790 to $0.0763. The market saw an upward rally that fluctuated up to a high of $0.0798 before it encountered a bearish pressure that massively dipped the momentum to the current price of $0.0763. Additionally, the bearish momentum defined the resistance level at $0.0797 and support level at $0.0762.
Almost all the indicators had signaled the bearish outlook. The RSI indicator X moved from high level 70 and is currently heading towards the oversold market territory that indicated a decrease in investor’s sentiments. This led to an increase in sellouts that brought the market cap of XLM to $1.4 billion.
Forecast
At the press time, all the indicators point at a more Bearish standpoint. The 21-day moving average is currently above the 7-day moving average, and the RSI indicator is tending south, which shows an increase in bearish pressure. New targets should be set at $0.0600. However, due to the recent partnership of Stellar and eToroX, Stellar might overcome the bearish momentum.
Cardano (ADA/USD)
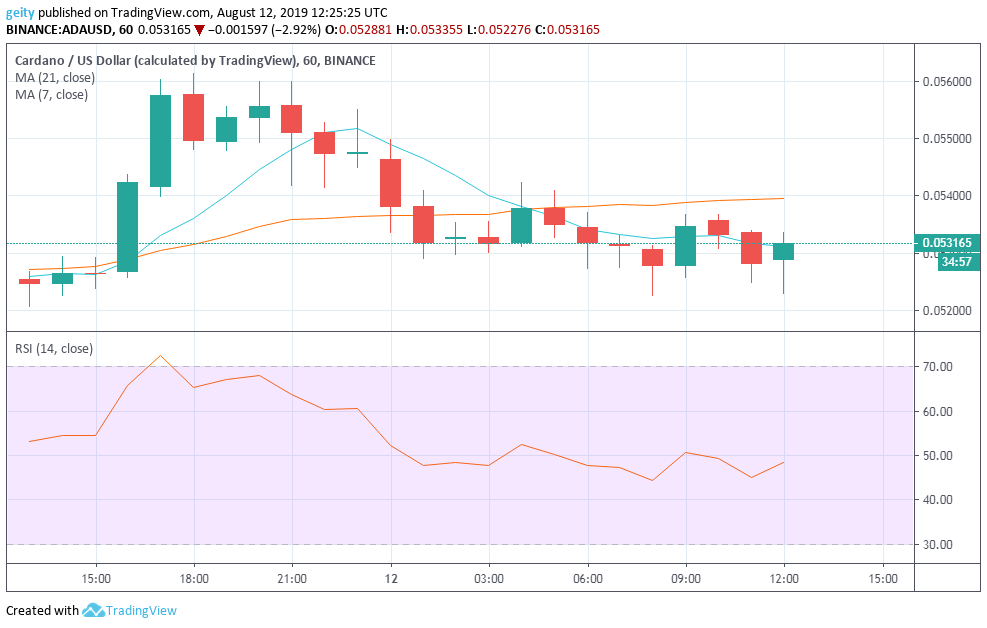
ADA/USD pair began trading yesterday at $0.0521 where it later jumped to a high of $0.0560. The pair’s price later faced a short-term period of consolidation between $0.0558 and $0.0548 level.
This was followed by a massive dip that later consolidated near support level $0.0527. ADA is currently trading at $0.0532 that total up to 2.19% gain that confirmed a bullish momentum in the last 24hrs.
The RSI indicator also moved from the overbought territory to currently at level 47 that signaled an increase in sellouts. Investors are showing the unwillingness to continue selling since they are anticipating for much better prices. The RSI indicator that is currently heading north beckoned this.
Forecast
The 21 day MA is now above the 7 day MA that indicates a further downtrend is to be expected. New targets should be set at $0.0520.
Ripple (XRP/USD)
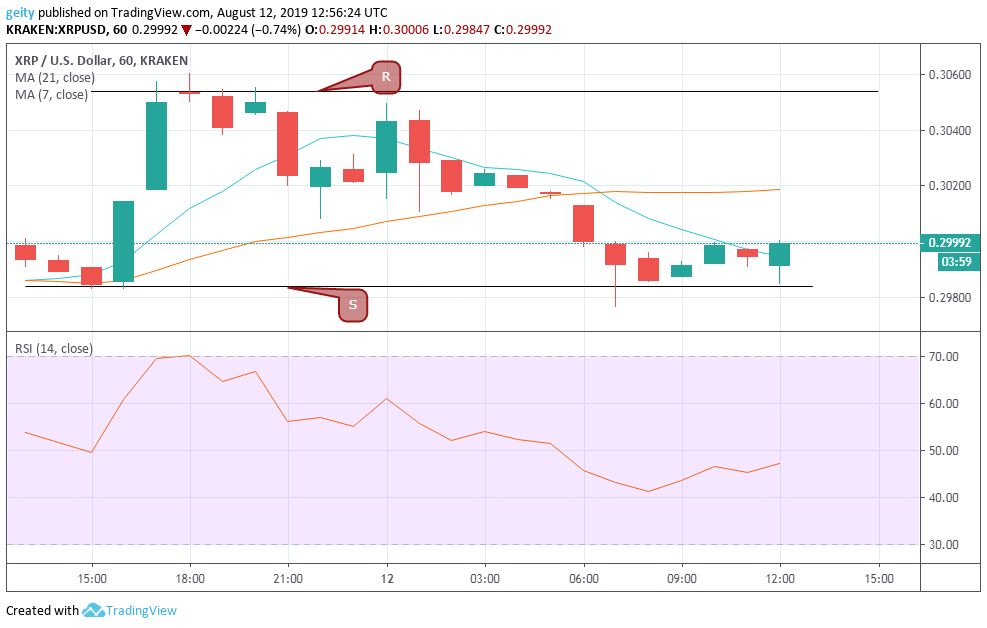
XRP/USD has gained by 0.19%, with a market valuation of $12.8 billion throughout the intraday. XRP began trading yesterday at $0.29936 where it later corrected gains to currently changing hands at $0.29992. Fundamental resistance level was found near $0.30538 and support level near $0.29839. Notably, both support and the resistance level were tested severally.
The market first saw an upward rally that was pushed up to a high of $0.30187 before embarking to a steady flow that later falls to the current price of $0.29992. The RSI indicator moved from level 70 to level 48 that signaled an increase in bearish pressure that might be due to reduced confidence in the coin by the investors. However, the RSI is currently heading north that signals a positive sign.
Forecast
The 21 day MA has currently crossed above the 7 day MA that signals a further bearish outlook. Nevertheless, if the price breaks $0.29839, then investors should go short and take profit at $0.28000.


